
The Profiler utility is available for interactive (online) and batch Natural applications. Natural interactive applications can also be profiled from NaturalONE which is described in detail in the NaturalONE documentation.
This document covers the following topics:
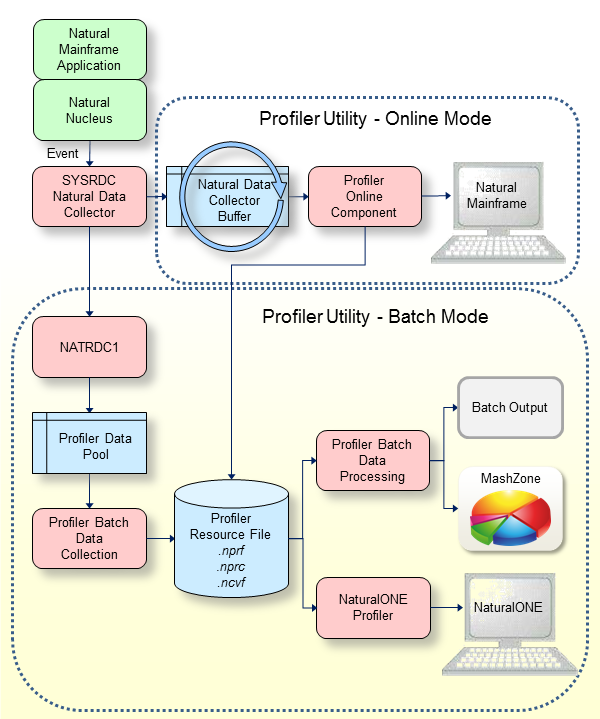
The graphic illustrates the process flow when the Profiler utility traces data in online or batch mode.
The Profiler utility is based on SYSRDC technology, as shown in the graphic. When an event such as a program start occurs in a Natural mainframe application, the Natural nucleus calls the Natural Data Collector of the SYSRDC utility which collects the Natural event data in the Natural Data Collector buffer and passes the event data to user exits of the Natural Data Collector. The way in which the event data is further processed depends on the mode in which you execute the Profiler utility.
The graphic is further explained in the following section:
- Profiler Utility - Online Mode
The Profiler utility in online mode is menu-based. It is used for a quick view of the last actions of an interactive Natural application.
The Natural Data Collector Buffer (maximum size of 128 KB) works in a wrap-around mode. It provides the most recent events whereas the oldest data is overwritten when the buffer is full. The data collection is stopped when the data is read and the buffer is cleared when the collection is restarted.
The Profiler Online Component reads the event data from the Natural Data Collector buffer. It provides functions to control profiler tracing, to select required event types, to maintain and display trace records, to download the event data to the PC and to save the event data as Profiler resource file. The Profiler resource file can be processed by the Profiler batch data processing functions and by NaturalONE.
- Profiler Utility - Batch Mode
The Profiler utility in batch mode is controlled by JCL input. It is designed for analyzing Natural batch applications.
The user exit NATRDC1 of the Natural Data Collector collects the Natural event data in the Profiler data pool. It extents the Natural Data Collector event record with additional event information and performs special functions such as filtering or sampling.
The Profiler Data Pool (maximum size 2 GB) collects the Natural event data for the Profiler utility in batch mode and for the NaturalONE Profiler. A special logic guarantees that no data is lost, even if the pool is full.
The Profiler Batch Data Collection reads the event data asynchronously from the Profiler data pool while the application and the tracing continue. It provides functions to control profiler tracing, to select required event types, to filter, sample or consolidate the data, to perform Natural code coverage, and to write the resulting events to a Profiler resource file. General statistics and an event trace with the most important data can be written to standard output.
The Profiler Resource File (extension
.nprf,.nprcor.ncvf) is a Natural resource allocated on the FNAT or FUSER system file according the resource library selection. It contains the event data in a compressed format with up to 80 percent data storage reduction. The data is combined in data blocks for an optimized transfer to NaturalONE.During Profiler Batch Data Processing, the Profiler reads and processes the event data from the Profiler resource files. It provides functions for data consolidation (aggregation), event tracing and program tracing. It offers a program summary, a line summary and a transaction summary and displays Profiler properties and statistics. For the Natural code coverage data, program and statement coverage reports are provided. The resulting data can be exported to a file in text or CSV (comma-separated values) format, or in the format expected by the Natural Profiler MashApp.
The Natural Profiler MashApp demonstrates how Profiler event data can be visualized with MashZone.
In the Natural Server view of NaturalONE, the Profiler resource files are listed as NPRF or NPRC resources. The context menu function Open with Natural Profiler reads the resource data to the NaturalONE Profiler. The NaturalONE Profiler provides the general analysis of the event data. It shows how the CPU time or elapsed time is distributed over the programs, statements and even program lines of the application and how often a statement was executed. Additionally, the full event trace is provided.
Coverage resource files (NCVF) can be added from the NaturalONE Server view to a project in the NaturalONE workspace. The context menu function Open with Natural Code Coverage reads the resource data and displays it in the Code Coverage view.
From the NaturalONE Code Coverage view, the Natural source editor can be opened. It shows all source line with one or more covered statements with a green background.
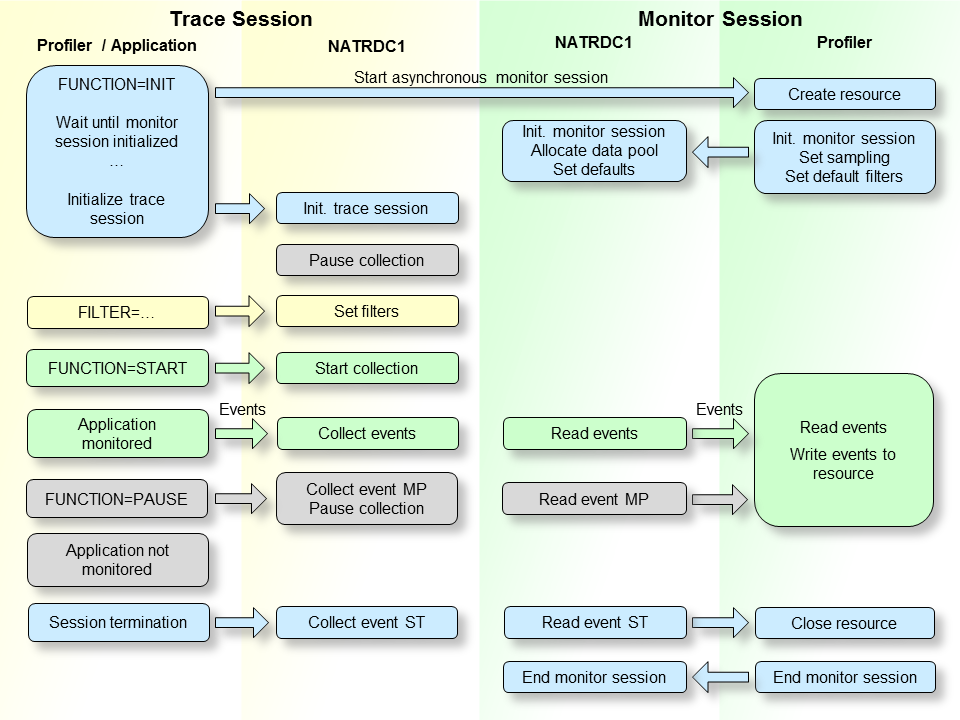
This graphic illustrates which actions the Profiler utility performs when profiling a Natural application in batch mode.
The Natural trace session is the session in which the Natural batch application is executed and the Profiler trace data is generated and collected.
When the Profiler utility INIT function is performed, a
new Natural session is started as an asynchronous subtask. This session is
called monitor session because it monitors the events. In both sessions, a
Natural nucleus instance with a linked NATRDC1 exit is running. The
INIT function triggers the execution of the Profiler utility in
the monitor session and forwards the INIT specific keywords to
it.
In the monitor session, the Profiler resource file is created in which the events will be saved later. Then, the NATRDC1 exit is called to initialize the monitor session. NATRDC1 allocates the Profiler data pool which is used to transfer the event data from the trace session to the monitor session. It also initializes the sampling and sets default values for filters.
When the Profiler in the trace session notices that the monitor session has been successfully initialized, it calls the NATRDC1 exit to initialize the trace session. By default, the data collection is paused after the initialization.
After the initialization, the Profiler filters can be set. This should be performed before the data collection is started so that the filters are immediately operative at start.
Data collection begins with the START function. The
Profiler in the trace session sends a start request to NATRDC1 which collects
the events of the subsequent Natural applications in the Profiler data pool.
Simultaneously, the Profiler in the monitor session calls NATRDC1 to read the
event data from the Profiler data pool. The space of the event data is
immediately released so that the trace session can reuse it. The Profiler in
the monitor session compresses the event data and writes it into the Profiler
resource file.
With the PAUSE function, data collection can be paused.
The Profiler in the trace session sends a pause request to NATRDC1 which writes
an MP (Monitor Pause) event into the Profiler data pool and
suspends data collection, that is, it refuses all events until a start request
is received or the trace session ends.
At the end of the application, an ST (session
termination) event is written to the Profiler data pool. However, the trace
session does not terminate right away (which would abort the monitor session
subtask). Instead, it waits for the monitor session to read the remaining data
from the Profiler data pool. When the Profiler in the monitor session finds the
ST event in the Profiler data pool, it closes the Profiler
resource file, writes the statistics and sends a termination request to NATRDC1
which ends the monitor session. Finally, the trace session terminates as
well.
The Profiler utility uses technology introduced with the NaturalONE
Profiler such as the NATRDC1 user exit and the Profiler data pool. Therefore,
the processing of the event data is restricted to NaturalONE users who can use
the NaturalONE Profiler and the Profiler utility to evaluate the event data.
The data consolidation and processing functions of the Profiler utility
(CONSOLIDATE, READ, MASHZONE,
LIST and DELETE) have to be activated before they can
be used. The activation is described in
Prerequisites.
This section covers the following topics:
When a Natural application is profiled, the Natural Profiler collects one record for each event. Depending on the application, this can produce huge amounts of data, especially when Natural statements are monitored. The more data the Profiler generates, the more time is required to transport the data from the server to the NaturalONE client.
The Profiler utility offers a server-side data consolidation which
significantly reduces the amount of data while increasing the transport flow
rate. The Profiler data consolidation combines similar records into one
consolidated record containing aggregated time values and a hit counter. The
consolidated data is written to a resource file which has the same name as the
corresponding unconsolidated resource file but an extension .nprc
(Natural Profiler resource consolidated).
During profiling, the data can be consolidated
immediately by switching on the CONSOLIDATE keyword of the
Profiler utility INIT function. Unconsolidated data of an NPRF file can be consolidated
later with the Profiler utility CONSOLIDATE function.
A Natural statement executes 1000 times in a FOR loop. The
unconsolidated data contains 1000 records for each execution of the statement.
Each record contains the event time and the CPU timestamp, besides other
information. The Profiler consolidation combines these 1000 records into one
consolidated record. All common information (like the library or program name)
is kept, the elapsed time and the CPU time of each execution of the statement
is determined, summarized and saved in the consolidation record. Additionally,
a hit count of 1000 is recorded.
Notes:
Natural code coverage is used to monitor executed and not-executed
statements of a Natural application. It is started by switching on the
COVERAGE keyword of the Profiler utility INIT
function.
For code coverage, the Profiler automatically uses an event filter so
that only the program start (PS) and Natural statement
(NS) events are collected. Moreover, in this case the statement
events contain a GP offset which is needed to uniquely identify the
statement.
For every accessed program, the corresponding cataloged program (GP) is read and the statement table is build up containing the line number, the GP offset, the object code, and the copycode information of the statement. Additionally, an inverted list of GP offsets is created for a quick search of the offset.
While the application is running, the GP offset of every executed statement is searched in the statement table and marked as covered. Finally, the covered statements and the not covered (those which have not been marked) statements are written to a Natural NCVF resource file.
When the NCVF coverage resource file is analyzed with the Profiler
READ function, the source of the monitored programs is read and
the lines are marked according to the coverage of the statements in the
line.
Note:
Natural code coverage is not provided for programs cataloged with
the Natural Optimizer Compiler (NOC).
The following graphic shows how the Profiler utility processes unconsolidated and consolidated data:
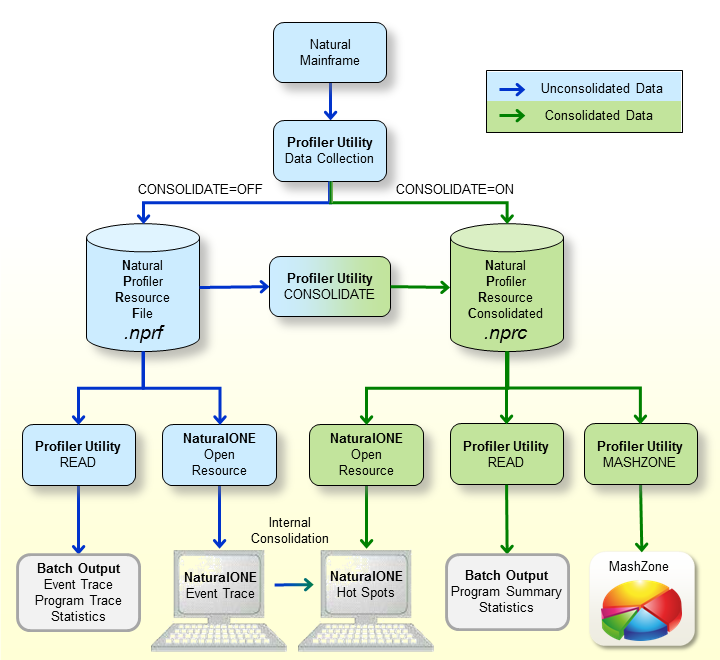
The graphic is explained in the following section:
When a Natural mainframe batch application is profiled with the
Profiler utility data collection, the resulting event data is written to a
Natural Profiler resource file (NPRF) or a Natural Profiler resource
consolidated (NPRC) file depending on the setting of the
CONSOLIDATE
keyword of the Profiler utility INIT function.
The Natural Profiler resource file (extension .nprf)
contains the event data in an unconsolidated format, which means that there is
one record for each event.
The Profiler utility READ function reads the
event data from the NPRF resource file. It provides an event trace, a program
trace and the Profiler statistics. The resulting data can be exported to a file
in text or CSV (comma-separated values) format.
If the NPRF resource file is opened from NaturalONE, the unconsolidated event data is listed on the NaturalONE Event Trace page.
The NaturalONE Hot Spots page shows the event data in a consolidated form. If the data derives from an NPRF resource file, NaturalONE consolidates the data internally.
The Profiler utility CONSOLIDATE function reads
the event data from the NPRF resource file, consolidates it and writes it to an
NPRC resource file.
The Natural Profiler resource consolidated file (extension
.nprc) contains the event data in a consolidated format, which
means that similar records are aggregated in one consolidated record. In
general, an NPRC resource file is much smaller than the corresponding NPRF
resource file and, therefore, much quicker to process.
If the NPRC resource file is opened from NaturalONE, the consolidated event data is shown on the Hot Spots page. It is not possible to view the event trace because the NPRC resource file does not contain the data of each single event.
The Profiler utility READ function reads the
event data from the NPRC resource file. It provides a trace of the consolidated
records, a program summary, a line summary, a transaction summary and Profiler
statistics. The resulting data can be exported to a file in text or CSV
(comma-separated values) format.
The Profiler utility MASHZONE function reads the
event data from the NPRC resource file and exports it in CSV (comma-separated
values) format as expected by the Natural Profiler MashApp.
The Natural Profiler MashApp visualizes the Profiler event data and statistics in MashZone.
In general, profilers are classified into event-based or statistical profilers. Statistical profilers, which operate by sampling, interrupt the operating system at regular intervals to receive the profiling data. The resulting data is not exact but a statistical approximation.
The Natural Profiler is an event-based profiler. It receives control and collects the profiling data whenever a Natural event occurs. Although the Natural Profiler does not interrupt the operating system, it offers a sampling technique that generates the same profiling data as statistical profilers.
Natural Profiler sampling works like a filter: it eliminates all events except the last one in a sampling interval. Additionally, it replaces the event CPU timestamp by the subsequent sampling time. This way, the Natural Profiler only collects those events that were active at the beginning of a sampling interval.
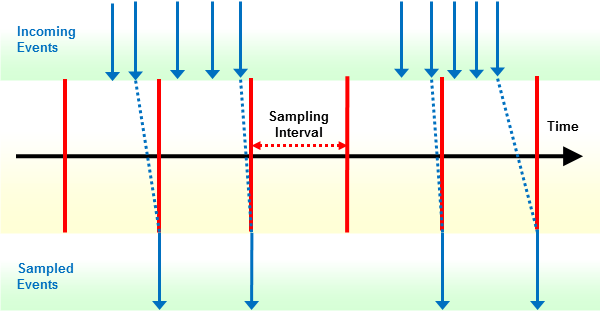
If you use Profiler sampling, consider the following:
Natural Profiler sampling provides a good estimation of the consumed CPU time. It does not provide other estimations such as hit counts, elapsed times, and Adabas times.
Natural Profiler sampling is a statistical approach which reduces the number of events severely with nearly the same CPU time results.
The smaller the sampling interval, the more accurate the result.
The higher the sampling interval, the less data is produced.
The resulting event duration is a multiple of the sampling interval.
The sampling generates at most one record per sampling interval.
Events which spent more time than a sampling interval need one record only.
The session termination (ST) event is recorded
unchanged.
If the total application CPU time is known and sampling is used, the number of events can be estimated:
Number of events ≈ |
|
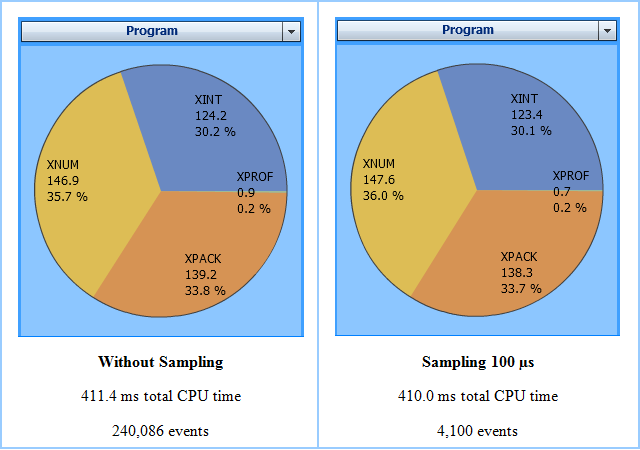
In the following example application, the program XPROF
calls three subprograms. The application is profiled twice:
Without sampling.
With sampling whereby a sampling interval of 100 microseconds is used.
For sampling, the following keywords are specified with the Profiler
utility INIT function:
FUNCTION=INIT            /* Initialize Profiling
  SAMPLING=ON            /* Use sampling
  INTERVAL=100           /* Microseconds
The Natural Profiler MashZone pie charts below show for each program the name of the program, the CPU time spent (in units of milliseconds) and the CPU time percentage with respect to the total CPU time. The left chart reflects the run without sampling and the right chart the run with sampling. Although the number of events has been reduced by the sampling to about 1.7 percent, the resulting CPU time and distribution are nearly the same.
Profiling an application usually impacts the performance of the application. The impact can concern the measurement and the overall job duration. The Natural Profiler has implemented several features to keep the measurement as accurate and the performance loss as low as possible.
The Profiler monitor session, which reads the data from the Profiler data pool and writes it into the Profiler resource file, is running as an asynchronous task. The time spent for the monitor session is therefore not taken into account for the application time measurement. Nevertheless, because the Profiler trace session has to wait at the end until the monitor session has finished, it can impact the overall job duration.
The NATRDC1 exit running in the Profiler trace session measures the CPU time needed for the assembling of the trace record separately and subtracts it from the session CPU time.
If Natural statement events are collected with the event filter
setting STATEMENT=ON, the Profiler disables the statement event
generation in the Natural nucleus as long as any block filter (library,
program, line, FNAT, event count or time filter) is active. This reduces the
load on the Natural nucleus, the SYSRDC data collector and finally on NATRDC1
which would otherwise reject the event.
The Profiler compresses the event data before it writes it into the resource. Compression can save up to 80 percent of data storage which reduces the number of I/O operations dramatically. The event data is also read by NaturalONE in the compressed format which increases the transport flow rate.
When running on a z/OS machine with zIIP (IBM System z Integrated Information Processor), time is lost if execution switches from the general purpose processor to the zIIP and vice versa. If you use Natural for zIIP with the Profiler, the NATRDC1 exit will run on the zIIP with a minimum number of switches.
If the Profiler data pool is full, the Profiler trace session waits one second so that the Profiler monitor session can read and release some space. If the data pool is too small, it can happen that the Profiler monitor session reads all data before the trace session is restarted. If the monitor session does not find data in the data pool, it waits one second for new data. Now both sessions wait alternating, which increases the overall job duration severely.
The Data pool empty after full property in the
Trace Session category of the Profiler statistics
indicates such alternating wait situations. If the value of this property is
greater than zero (0), increase the Natural profile parameter
PDPSIZE to an appropriate value.
PDPSIZE=50000
Profiling a long-running batch application can produce a huge amount of data, especially when Natural statements are monitored.
This section describes how to minimize the number of events to be monitored while keeping essential information:
If the batch job starts multiple Natural applications then initialize and start the Profiler immediately before the first application of interest. As soon as the Profiler is initialized, it has an impact on the performance even if no events are collected.
Pause the Profiler for applications which are not of interest and restart it for the next application of interest.
Eventually, use the application programming interface (API) to start and pause profiling at specific points in the application.
A job executes three Natural applications. From these three applications, only the second one is of interest for a Profiler analysis.
Initialize and start profiling immediately before the second application starts executing, and pause profiling right after execution as in the example below:
APP-01
PROFILER
FUNCTION=INIT,...         /* Initialize profiling
FUNCTION=START            /* Start data collection
END-PROFILER              /* End Profiler input
APP-02
PROFILER
FUNCTION=PAUSE            /* Pause data collection
END-PROFILER              /* End Profiler input
APP-03
FIN
/*
This way, profiling has no impact on the performance of the other applications.
Use the event filter FNAT=OFF to avoid monitoring
Natural system programs or do not specify the FNAT keyword at
all.
Statement events have the most impact on the performance and quantity. The other events have only a low impact on the performance but enlarge the quantity. Monitor statement events only if you really need them. Monitor from the non-statement events only those you want to analyze.
For example, if you want to view in NaturalONE the program hot spots but neither the statement nor the line hot spots, the following Profiler event filter setting is sufficient:
FILTER=EVENT            /* Set event filter
  EVENT=P               /* Program events
With this setting, only the program and session events needed for the program hot spots are monitored, whereas statement and FNAT collection are deactivated by default.
Monitor only the libraries and programs that you want to analyze. Use program filter to restrict profiling.
For example, if a (first) Profiler run without statement collection
has shown that the most CPU time was spent in the program HIGHCPU,
then you might only want to know in which line of this program the most time
was spent and which other events (database calls, external program calls, etc.)
are performed:
FILTER=PROGRAM          /* Set program filter
  LIBRARY=PRFDEMO       /* Monitored library
  PROGRAM=HIGHCPU       /* Monitored program
FILTER=EVENT            /* Set event filter
  EVENT=ALL             /* All events
  STATEMENT=ON          /* Collect statements (no count)
For the CPU analysis of a long-running application, we recommend sampling. If you use already filter settings to reduce the number of events, you can additionally activate sampling to reduce the number of events further.
Most event data is generated when statements are collected. Therefore, sampling will often be used in conjunction with statement collection. For very long-running applications, however, it might be helpful to use sampling even if no statements are collected. If you use sampling without statement collection, we recommend a sampling interval that is higher than that specified when statements are collected.
Sampling has only restricted impact on the Profiler performance but it can reduce the amount of data dramatically. The formula in the section Sampling rearranged here can be used to choose a sampling interval so that the number of events is equal to or less than an approximate value:
Sampling interval ≥ |
|
For example, a batch application requires 40 minutes of CPU time (2,400,000,000 µs). Sampling should restrict the number of events to at most 500,000 events. The corresponding sampling interval can be calculated with the formula above.
Sampling interval ≥ |
|
= 4,800 |
Specify the following sampling setting for the Profiler utility
INIT function:
SAMPLING=ON
INTERVAL=4800
If you want to analyze the performance of the event data and do not require an event or program trace, we recommend that you consolidate the event data on the server side. The Profiler data consolidation combines similar records into one consolidated record containing aggregated time values and a hit counter.
The event data can be consolidated during data collection with
the CONSOLIDATE keyword of the Profiler utility INIT
function as described in the section Initializing
Profiling.
Unconsolidated event data of an NPRF (Natural Profiler resource file)
resource file can be consolidated with the Profiler utility
CONSOLIDATE function as described in the section
Consolidating Event
Data.
Consolidated data is written to an NPRC (Natural Profiler resource consolidated) resource file which is in general significantly smaller than the corresponding NPRF resource file. It opens much faster from NaturalONE and provides the same hot spots as the NPRF resource file.
Note:
Natural code coverage data written to an NCVF resource file is
automatically consolidated by Natural code coverage.
The RDC profile parameter configures
the Natural Data Collector used by the Profiler utility and the SYSRDC utility:
see RDC - Configure the Natural Data
Collector in the Parameter Reference
documentation.
The CMRDC interface controls the data recorded in the Natural Data Collector buffer: see Calling the CMRDC Interface in the section SYSRDC Utility in the Utilities documentation.
The use of the Profiler utility can be controlled by Natural Security, see Protecting Utilities in the Natural Security documentation.
The use of the NaturalONE Profiler and NaturalONE code coverage is described in the NaturalONE documentation.