This document provides general information on code coverage of Natural applications.
In general, code coverage measures the degree to which the source code of a program is executed. It is often used for systematic software testing. The higher the code coverage percentage is, the lower is the chance that the code contains undetected software bugs in code that is not executed.
The Natural code coverage is used to monitor the executed statements of a Natural application. It collects the coverage data while the application is executed and provides tools to analyze the collected data afterwards.
The Code Coverage view of NaturalONE (Software AG’s Eclipse-based development environment) and the Program Coverage table of the Profiler utility show - expressed as a percentage - how many of the statements of the Natural objects have been executed. The Natural Coverage Plugin for Jenkins visualizes the outcome of a Natural coverage cycle directly in the Jenkins job result pages.
In the NaturalONE editor and in the Statement Coverage table of the Profiler utility you can see, which individual statement lines of a Natural object have been executed. Here you can also see the statement lines which have been missed or have only been partly covered.
If a statement source uses multiple lines, only the line in which the statement begins is mentioned in the coverage reports.
You can export the coverage data with the Profiler utility output in text or table (CSV) format. The CSV table can be analyzed with a spreadsheet software such as Microsoft Excel.
If a Natural source contains INCLUDE
statements, the corresponding copycode is included in the generated object (the
GP). For the coverage, we can monitor two statement
counts:
The number of the statements in the GP which includes all copycodes recursively (a copycode can include further copycodes).
The number of the statements in the source which does not include the copycodes.
The GP coverage reflects the percentage of the covered statements in the GP including copycodes; whereas the source coverage reflects the percentage of the covered statements in the source not including copycodes.
You can perform the Natural code coverage on UNIX, Windows and mainframe platforms. How to proceed depends on the platform and the application processing mode used:
Code coverage of mainframe interactive applications remotely executed from Natural Studio or RPC is performed using the Profiler utility in batch mode.
Code coverage of mainframe batch applications is performed using the Profiler utility in batch mode.
Note:
Code coverage is not available for mainframe interactive
applications running locally on a mainframe or remote from NaturalONE.
Code coverage of UNIX and Windows interactive applications is performed with the NaturalONE code coverage or the Natural code coverage for UNIX and Windows, respectively.
Code coverage of UNIX and Windows batch applications is performed with Natural code coverage for UNIX and Windows, respectively.
This section summarizes the key features of the Natural profiling tools:
Reads and analyzes Natural code coverage resource files containing coverage data collected by the mainframe Profiler utility in batch mode or by the Natural code coverage for UNIX or Windows.
Interactive Natural applications from UNIX or Windows can be covered by activating the Natural code coverage for UNIX or Windows and reading the corresponding Natural code coverage resource file.
The Natural code coverage view shows which percentage of the statements of the Natural objects have been executed.
From the Natural code coverage view the involved Natural objects can be edited. The NaturalONE editor displays all covered lines with a green background.
Note:
Interactive code coverage of Natural applications from mainframe
platforms is currently not supported.
Code coverage of interactive or Natural batch applications from UNIX or Windows platforms.
Provides features for big data handling:
automatic event filter,
automatic data consolidation.
Saves the code coverage data as a Natural code coverage resource file.
Code coverage of Natural batch applications from mainframe platforms.
Code coverage of mainframe interactive applications remotely executed from Natural Studio or against a Natural RPC server.
Provides features for big data handling:
program, count and time filters,
automatic event filter,
automatic data consolidation.
Saves code coverage data as a Natural code coverage resource file.
Reads and analyzes Natural code coverage resource files.
Lists the Program Coverage table for all accessed Natural objects with
percentage of the covered statements,
number of covered statements,
number of missed (not covered) statements and
total number of statements of the object.
The Statement Coverage lists the source of each accessed Natural objects and shows for each line the percentage of the covered statements.
Exports Natural code coverage data in CSV (comma-separated values) format which can be further analyzed with a spreadsheet software (e.g. Microsoft Excel).
Collects and displays Profiler and code coverage properties and statistics.
Note:
On the mainframe, there is no one-to-one relationship between a
Natural source code statement and the corresponding object code in the
cataloged object. The Natural code coverage on the mainframe monitors the
object code rather than the Natural source code. Therefore, multiple Natural
statements can be merged into one coverage entry and conversely, one Natural
statement can cover multiple coverage entries.
Reads and analyzes Natural code coverage resource files.
Lists the Program Coverage table for all accessed Natural objects with
percentage of the covered statements,
number of covered statements,
number of missed (not covered) statements and
total number of statements of the object.
The Statement Coverage lists the source of each accessed Natural objects and shows for each line the percentage of the covered statements.
Exports Natural code coverage data in CSV (comma-separated values) format which can be further analyzed with a spreadsheet software (e.g. Microsoft Excel).
Note:
On Windows and UNIX, missed statements are not collected. Therefore
the Statement Coverage can only mark lines containing covered statements and
the coverage of these lines is always 100%.
Template for coloring the Natural code coverage data exported in CSV (comma-separated values) format by the Natural Profiler utility.
Program and copycode coverage with source and GP counters for
percentage of the covered statements,
number of covered statements,
number of missed (not covered) statements and
total number of statements of the object.
Statement Coverage of the object source whereby the lines are colored in
green – if all statements of the line are covered,
yellow – if the statements of the line are partly covered,
red – if all statements of the line are missed,
gray – if the line is empty or contains only comments.
Profiler and code coverage properties and statistics (for mainframe data).
Note:
A Microsoft Excel spreadsheet template for Natural code coverage is
available as a resource in the Natural Profiler library SYSPRFLR
on UNIX and Windows.
This section describes the evaluations provided by the Natural code coverage tools:
The program coverage provides you with an overview of the programs executed and the amount of the code that has been covered by the application.
The Program Coverage report of the Profiler utility shows the coverage (in percentage of the total number of statements) of each Natural object executed. It shows for each object how many statements have been covered or missed and the total number of statements. In addition, it summarizes the values for all objects in a library and the totals over all libraries.
If the output is written in text format, only the GP coverage is provided. If the data is exported in CSV (comma-separated values) format, the source coverage is given as well. Additionally, the counters for all included copycodes are printed.
The following is an example for text format:
Program Coverage
----------------
Library  Object   Ty Coverage%  Covered    Missed    Total
COVDEMO  TESTCOVN N      84.0%       37         7       44
COVDEMO  TESTCOVP P      69.2%        9         4       13
COVDEMO  -------- --     80.7%       46        11       57
Totals   -------- --     80.7%       46        11       57
In the Program Coverage example above, 69.2% of
13 statements in the TESTCOVP program were covered, corresponding
to 9 covered and 4 missed statements. 80.7% of the statements of the accessed
objects in the library COVDEMO were covered, which is also the
total value for the whole application run.
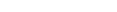
The Code Coverage view of NaturalONE shows the
coverage (in percentage of the total number of statements) of each Natural
object executed. It shows for each object how many statements have been covered
or missed and the total number of statements. If copycodes are included, the
object node can be opened to view the coverage of the copycode. In general, the
counters reflect the GP coverage (copycodes included). The source coverage
(copycodes not included) is displayed in the line where the object name is
enclosed in the << >> brackets.
From any line you can directly navigate to the corresponding source code to view the statement coverage.
Example:
In the example above, the TESTCOVP program has a GP
coverage of 69.2 percent whereby in the program itself all 8 statements are
covered (100% source coverage) and in the included copycode
TESTCOVC only 1 of 5 statements was covered.
The statement coverage shows which lines of the program have been executed. For mainframe data, the Profiler utility also indicates which lines containing statements have not been executed or are only executed partly.
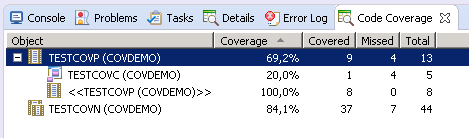
The Statement Coverage report of the Profiler utility shows for each source line the coverage of the statements in the line. If the data is exported in CSV (comma-separated values) format, the number of covered or missed statements and the total number of statements in the line are printed as well. The Microsoft Excel spreadsheet template delivered with Natural on UNIX and Windows, can be used to color the lines according to the coverage.
If a source contains an INCLUDE statement,
the corresponding copycode source is included in the report right after the
INCLUDE statement.
The following is an example for an export in CSV format colored using a Microsoft Excel spreadsheet:
The three red lines of the subprogram TESTCOVN have not
been executed. Thus the test run does not cover the new test function
9. It also neither covers the (old) function 0 nor
the case when the subprogram is called with an unsupported function.
The data originates from the mainframe. Therefore, the counts refer
object code statements rather than Natural statements. A Natural
VALUE statement can correspond up to 3 object code
statements. The yellow lines refer to VALUE
statements where some of the object code has been covered and some not.
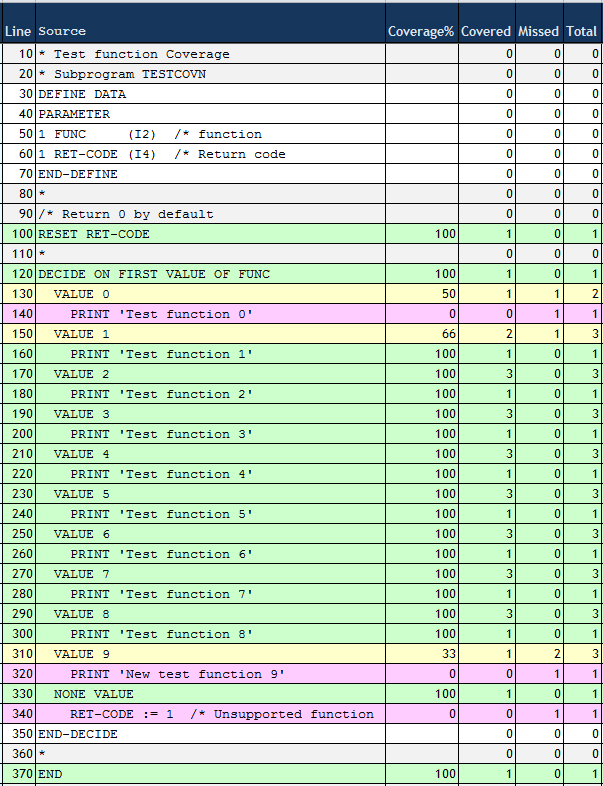
If the source editor is opened from the Code Coverage view in NaturalONE, the source is colored according to code coverage. Every line in which one or more statements are covered, is colored with a green background.
Example:
The source editor shows all lines in which at least one statement has
been executed with a green background. Therefore, all lines except line 19, 37
and 39 of the DECIDE statement have been executed.
The Profiler properties and statistics provided by the Natural Profiler utility lists Profiler properties such as the Profiler revision, and statistics of the monitored application that show, for example, the total CPU time and the elapsed time. For a code coverage run, it shows also the coverage statistics.
***************************************************************************
* 13:30:48          ***** NATURAL PROFILER UTILITY *****         2017-09-04
* User SAG                     - Statistics -                       COVREAD
*
* General Info
* Machine class ...................... MAINFRAME
* Environment ........................ Batch
...
* Coverage
* Coverage ........................... ON
* Missed statements recorded ......... ON
* Coverage records ................... 60
* Program information records ........ 3
* Coverage records/block ............. 60
* Bytes/coverage record .............. 10.3
* Programs covered ................... 2
* Statement coverage (percent) ....... 80.7
* Statements covered ................. 46
* Statements missed .................. 11
* Statements total ................... 57