
The Profiler utility is available on the mainframe for online and batch Natural applications. Natural mainframe online applications can also be profiled from NaturalONE which is described in detail in the NaturalONE documentation.
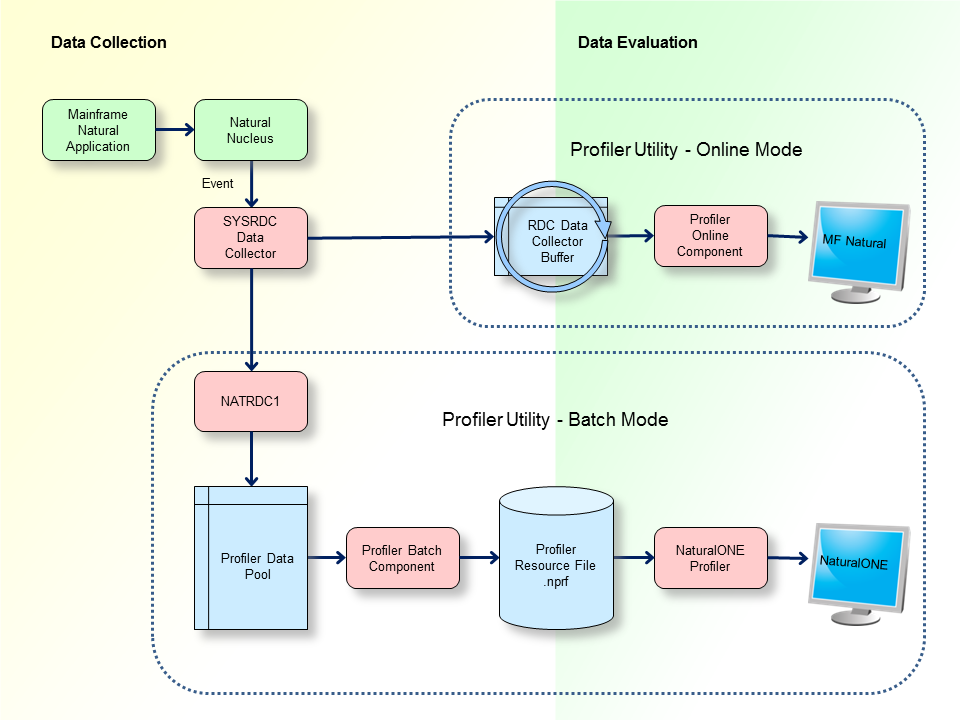
The Profiler utility is based on the SYSRDC technology. The SYSRDC Data Collector collects the Natural event data in the RDC Data Collector buffer and passes the event data to RDC user exits.
The Profiler utility in online mode is menu-based. It is designed for getting a quick view to the last actions of a Natural online application.
The RDC Data Collector buffer (maximum size 128 KB) works in a wrap-around mode. It provides the most recent events whereas the oldest data is overwritten when the buffer is full. The data collection is stopped when the data is read and the buffer is cleared when the collection is restarted.
The Profiler online component reads the event data from the RDC Data Collector buffer. It provides functions to control profiler tracing, to select required event types, to maintain and display trace records and to download the event data to the PC.
The Profiler utility in batch mode is controlled by JCL input. It is designed for analyzing Natural batch applications.
The RDC user exit NATRDC1 collects the Natural event data in the Profiler data pool. It extents the RDC event record with additional event information and performs special functions such as filtering or sampling.
The Profiler data pool (maximum size 2 GB) collects the Natural event data for the Profiler utility in batch mode and for the NaturalONE Profiler. A special logic guarantees that no data is lost, even if the pool is full.
The Profiler batch component reads the event data asynchronously from the Profiler data pool while the application and the tracing continue. It provides functions to control profiler tracing, to select required event types, to filter or sample the data and to write the resulting events to a Profiler resource file. General statistics and an event trace with the most important data can be written to the batch output.
The Profiler resource file (extension
nprf) is a Natural resource allocated on the FNAT or FUSER system
file according the resource library selection. It contains the event data in a
compressed format with up to 80% data storage reduction. The data is combined
in data blocks for an optimized transfer to NaturalONE.
In the NaturalONE server view, the Profiler resource files are listed as NPRF resources. The context menu function Open with Natural Profiler reads the resource data into the NaturalONE Profiler. The NaturalONE Profiler provides the general analysis of the event data. It shows how the CPU or elapsed time is distributed over the programs, statements and even program lines of the application and how often a statement was executed. Additionally, the full event trace is provided. The NaturalONE Profiler is described in detail in the NaturalONE documentation.
RDC - Configure the Natural Data Collector in the Parameter Reference documentation.
Calling the CMRDC Interface in the SYSRDC Utility documentation.
The use of the Profiler utility can be controlled by Natural Security, see Protecting Utilities in the Natural Security documentation.
The usage of the NaturalONE Profiler is described in the NaturalONE documentation.