
The Profiler utility in batch mode is designed for analyzing Natural batch applications. The utility is controlled by JCL input and provides functions to control profiler tracing, to select required event types, to filter or sample the data and to write the resulting events to a Profiler resource file. Statistics and an event trace with the most important data can be written to the batch output. The Profiler resource file can be read by NaturalONE which displays the full event trace and provides a performance analysis (hot spots) of the Natural batch application.
This document covers the following topics:
To use the Profiler utility in batch mode, the following prerequisites must be met:
The following Natural profile parameter settings must be used:
RDCSIZE=2 to activate the Natural Data Collector
(without recording data in the RDC Data Collector buffer);
RDCEXIT=NATRDC1 to define NATRDC1 as RDC user exit.
Additionally, the PDPSIZE parameter can be used to modify
the size of the Profiler data pool, for example by specifying
RDCSIZE=2,RDCEXIT=NATRDC1,PDPSIZE=1000
For more details regarding these parameters, see
RDCSIZE - Size of Buffer for the Natural Data Collector;
RDCEXIT - Define Natural Data Collector User Exits;
PDPSIZE - Size of the Profiler Data Pool.
in the Parameter Reference documentation.
The Natural nucleus must be reentrant and reusable. Use the following linkage options:
RENT,REUS
By default, Natural resource files are not displayed in NDV environments such as NaturalONE or Natural Studio. For analyzing the Profiler event data, the resource file must be accessed from NaturalONE. Therefore you have to modify the NDV behavior.
![]() To display resource files in an NDV environment
To display resource files in an NDV environment
Copy the source code of the NDV user exit NDV-SX03 from
SYSLIB into a user library.
Edit the member. Adjust the code as described below:
DISPLAY-RESOURCES := 'Y' /* Display resources in NaturalONE/Studio
Catalog it under the name NDV-UX03.
Copy it back into the Natural system library SYSLIB or
into the library SYSLIBS or SYSTEM.
This section describes how the Profiler utility works in batch mode.
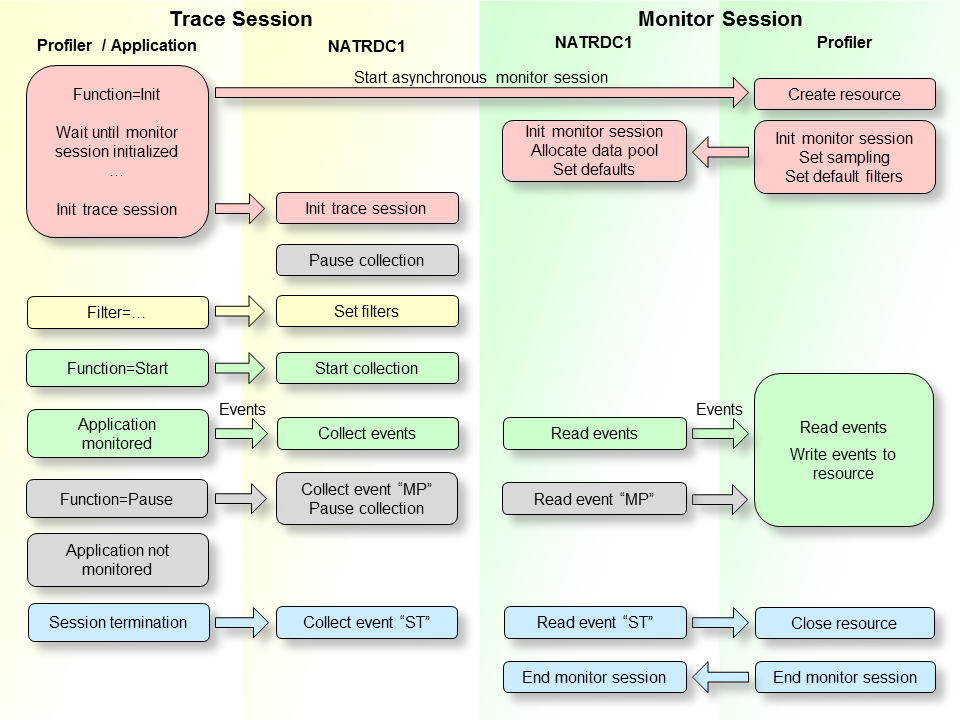
The Natural trace session is the session in which the Natural batch application is executed and the Profiler trace data is generated and collected.
When the Profiler INIT function is
performed, a new Natural session is started as asynchronous subtask. This
session is named monitor session because it
monitors the events. In both sessions a Natural nucleus instance with a linked
NATRDC1 exit is running. The INIT
function triggers the execution of the Profiler utility in the monitor session
and forwards the INIT specific keywords to it. In the monitor
session the Profiler resource file is created in
which the events will be saved later. Then the NATRDC1 exit is called to
initialize the monitor session. NATRDC1 allocates the Profiler data pool which
is used to transfer the event data from the trace session to the monitor
session. It also initializes the sampling and sets default values for
filters.
When the Profiler in the trace session notices that the monitor session has been successfully initialized, it calls the NATRDC1 exit to initialize the trace session. By default, the data collection is paused after the initialization.
After the initialization, the Profiler filters can be set. This should be performed before the data collection is started so that the filters are immediately operative at start.
Data collection begins with the START function. The Profiler in the trace session sends a start request to NATRDC1 which collects the events of the subsequent Natural applications in the Profiler data pool. Simultaneously, the Profiler in the monitor session calls NATRDC1 to read the event data from the Profiler data pool. The space of the event data is immediately released so that the trace session can reuse it. The Profiler in the monitor session compresses the event data and writes it into the Profiler resource file.
With the Profiler PAUSE function data collection can be paused. The Profiler in the trace session sends a pause request to NATRDC1 which writes an “MP” (monitor pause) event into the Profiler data pool and suspends data collection, i.e. it refuses all events until a start request is received or the trace session ends.
At the end of the application, an “ST” (session termination) event is written into the Profiler data pool. However, the trace session does not terminate right away (which would abort the monitor session subtask). Instead, it waits for the monitor session to read the remaining data from the Profiler data pool. When the Profiler in the monitor session finds the “ST” event in the Profiler data pool, it closes the Profiler resource file, writes the statistics and sends a termination request to NATRDC1 which ends the monitor session. Finally the trace session terminates as well.
During a Natural session, different kinds of events can occur (for example "starting a program") where the Profiler collects data specific to the event in a trace record. Each event is associated with an event type, that is, a one or two letter code. The following events and event types are available:
| Event | Event Type | When the Event Occurs |
|---|---|---|
| Session Initialization | SI | When a Natural batch session is initialized. Because the Profiler monitor session starts after the trace session, this event cannot be monitored. |
| Session Termination | ST | When a Natural batch session is terminated. The Profiler always monitors this event. |
| Program Load | PL | When a program (Natural object) is loaded or when it is already located in the buffer pool. |
| Program Start | PS | When a program (Natural object) is started. |
| Program Termination | PT | When a program (Natural object) is terminated. |
| Program Resume | PR | When a program (Natural object) resumes control after another Natural object has been executed or when control returns to level 0 (no program active). |
| Before Database Call | DB | Before a database call is executed. |
| After Database Call | DA | After a database call has been executed. |
| Before Terminal I/O | IB | Before a terminal input/output is executed. |
| After Terminal I/O | IA | After a terminal input/output has been executed. |
| Before External Program Call | CB | Before an external program call (CALL statement) is executed. |
| After External Program Call | CA | After an external program call (CALL statement) has been executed. |
| Runtime Error | E | When a Natural runtime error has occurred. |
| Natural Statement | NS | When a Natural statement is executed. For technical reasons, there is no one-to-one relationship between a Natural source code statement and the corresponding object code in the cataloged object. Therefore, multiple Natural statements can be merged into one NS event and conversely, one Natural statement can cover multiple NS events. |
| Inbound RPC Message | RI | When the RPC server layer receives the client request. |
| Start of RPC Request Execution | RS | When the RPC server layer calls the Natural server program. |
| Outbound RPC Request Message | RO | When the RPC server returns the result to the client. |
| User-Defined Event | U | When a user-defined event was generated. See Write User-Defined Event. |
| Monitor Pause | MP | When the data collection is paused. |
With each collected event, a CPU and an event timestamp are recorded. In general, a timestamp is taken at the beginning of an event. The duration of an event therefore equals the time that elapses between the timestamp of the event and the timestamp of the event that follows.
Most events are also listed as Data-Collecting Events in the SYSRDC Utility. The following event types are only provided by the NATRDC1 exit and are therefore only available with the Profiler utility in batch (and the NaturalONE Profiler):
Program Resume (PR)
Completes the program events and enables a context-free time
analysis.
Monitor Pause (MP)
Indicates the start of a time period in which the data collection was
paused. The pause event can be caused by an explicit pause request, at the
start of a block filter or at a data pool full situation. The duration of the
pause is not considered by the application performance analysis.
In general the collected data elements are listed in Data Collected in the SYSRDC Utility. In the following we list only the data elements which are exclusively provided or have been enhanced by the NATRDC1 exit and are therefore only available with the Profiler utility in batch mode (and the NaturalONE Profiler). Note that the Profiler does not record internal data (such as addresses) which is provided by SYSRDC/NATRDC1.
We distinguish between:
In addition to the data provided by the SYSRDC utility, the following data elements are collected at every event:
Session CPU time in units of microseconds
Statement op-code (SYSRDC provides it in the statement-specific data only)
Event counter
Program library (SYSRDC provides only the application name)
Copycode name
Copycode library
Notes:
STATEMENT=COUNT is used.
Some data elements are only collected at specific events. The table shows only those data elements that are not provided by or differ from SYSRDC:
| Event | Data Elements |
|---|---|
| Session Termination | Monitor CPU time (microseconds) – the total time the NATRDC1 exit needed for the data collection. The monitor CPU time is measured separately and extracted from the application CPU time. Both durations are displayed in the Profiler Statistics. |
| Program Resume | There is no event specific data for the program resume event. |
| Natural Statement | There is no event specific data for the Natural
statement event. The statement op-code (which is provided by
SYSRDC in the statement specific data) is given with the general data. Compared
with SYSRDC which needs up to 250 bytes for the statement-specific data,
NATRDC1 requires only 2 bytes. The space needed for the statement event data in
the Profiler data pool is thereby reduced dramatically.
|
| Monitor Pause | The type of the monitor pause. Possible values:
|
This section covers instructions for invoking and terminating the Profiler utility in batch mode.
![]() To invoke the Profiler utility
To invoke the Profiler utility
Enter the following system command into the primary command input
data set CMSYNIN:
PROFILER
Note:
After the PROFILER system command, the Profiler
expects one or more lines with Profiler keyword entries.
![]() To terminate the Profiler utility
To terminate the Profiler utility
Enter the following Profiler keyword into the primary command input
data set CMSYNIN:
END-PROFILER
Or:
END
Or:
.
The Profiler utility in batch mode reads the Profiler keywords that
control the profiling from the primary command input data set
CMSYNIN. The Profiler reads the input lines until it reaches the
END-PROFILER keyword (or END or .).
The symbols used in the syntax diagrams shown in this section are explained in System Command Syntax in the System Commands documentation.
A profiler input line is formally described by one of the following expressions:
keyword[=value][,keyword[=value]]...
keyword
[value]
...
Notes:
IM=D).
STACK or if the data is entered in
forms mode (IM=F).
The following rules apply:
Empty lines and lines starting with an asterisk (*) are
ignored.
All characters in a line from "/*" to "*/" or to the end of the line are ignored.
Some keywords have no associated value.
Blanks can be added before or after the keyword or value.
Multiple keywords in a line are separated by commas (applies to the 1st expression only).
A value can be enclosed in quotation marks ('value').
A value must not contain a comma.
Keywords and values can be specified in upper or lower case.
The maximum input line length is 78 characters.
The Profiler utility can be executed multiple times in one Natural
session. For example, it is first executed with the INIT and
START function, then, after the execution of a user program, it is
executed with the PAUSE function.
The following Natural batch example (on z/OS) shows the original JCL
which runs the XPROF program on the PRFDEMO library
(lines with black characters) and the Profiler utility input lines which are
used to profile the XPROF program (lines
with blue characters).
//CMSYNIN  DD  *
PROFILER
FUNCTION=INIT                /* Initialize profiling
  RESOURCE=ON                /* Write to resource
  RESOURCE-NAME='Demo01',REPLACE=YES  /* Resource name
  RESOURCE-LIB=PRFDATA       /* Resource library
FUNCTION=START               /* Start data collection
END-PROFILER                 /* End Profiler input
LOGON PRFDEMO
XPROF
10000
FIN
The following Natural batch example (on z/OS) demonstrates how the
Profiler is to be executed with the profile parameter
STACK.
STACK=(
 PROFILER FUNCTION:INIT:
   RESOURCE:ON:
   RESOURCE-LIB:PRFDATA:
   REPLACE:YES:
 FUNCTION:START:
 END-PROFILER;
 LOGON PRFDEMO
 )
The Profiler utility in batch mode knows general keywords and specific keywords. Specific keywords must be specified directly after an appropriate general keyword and are described in the corresponding sections.
| Keyword | Value | Description |
|---|---|---|
| FUNCTION | Perform a Profiler function. | |
| INIT | Initialize profiling. This function is mandatory for profiling. See Initialization. | |
| START | Start or restart the data collection. See Starting and Pausing Data Collection. | |
| PAUSE | Pause the data collection. See Starting and Pausing Data Collection. | |
| TEXT | Add a user event to the event data. See Writing User-Defined Events. | |
| DELETE | Delete a Natural Profiler resource file. See Maintaining Profiler Resource Files. | |
| FILTER | Define Profiler filters to reduce the amount of event data. See Filter. | |
| EVENT | Set the event, FNAT and statement filters. | |
| PROGRAM | Set the library, program and line filters. | |
| COUNT | Set the event count filter. | |
| TIME | Set the CPU time filter. | |
| ON-ERROR | Determines how Profiler error situations are
handled.
Default: |
|
| TERMINATE | The Profiler forces a termination of the Natural session. | |
| CONTINUE | The profiling is stopped but the Natural session continues. | |
| TRACE | 0-10 |
Set the level of internal trace of the Profiler trace session. The
internal trace contains information such as Profiler errors and is written to
the batch output of the trace session ( Default: |
| HELP | A summarized description of the Profiler keywords is written to the batch output. | |
|
END-PROFILER END . |
End of Profiler input. The keyword
END-PROFILER, END or a dot (.) indicates
the end of the Profiler input.
|
|
| ONLINE | Perform the online Profiler utility in a batch
run. This option is for compatibility reasons: if the Profiler utility was
started in a previous Natural version (8.2.4 and below), the Profiler online
menu was opened. If this functionality is still required, use
ONLINE as first keyword. All subsequent input is handled by the
Profiler online menus.
|
The Profiler INIT function initializes profiling. The
INIT function must be performed before any of the Profiler
functions START, PAUSE or TEXT or any
Profiler filter.
![]() To initialize the Profiler
To initialize the Profiler
Enter the following Profiler keyword:
FUNCTION=INIT
After the FUNCTION=INIT entry, lines with the following
keywords specific to the INIT function can be entered:
| Keyword | Value | Description |
|---|---|---|
| Resource |
Specifies whether the event data is to be written to a Natural Profiler resource file. Default: |
|
| On | The event data is written to a Natural Profiler resource file and can be analyzed with NaturalONE. | |
| Off | The event data is not written to a Natural Profiler resource file. This option can be used if only the Profiler event trace or the statistics are required. | |
| Resource-Name | resource |
The name of the Profiler resource file in which the event data is
saved for a later analysis by NaturalONE. If the extension Default:
where and yyyymmdd_hhiiss is the resource allocation date and time. |
| Resource-Lib | library |
The name of the Natural library in which the resource is allocated. Default: where |
| Replace |
Specifies whether the resource is replaced if it already exists. Default: |
|
| Yes | Replace the resource if it exists. | |
| No | Do not replace the resource. If the resource already exists, a message is written and no profiling is performed. | |
| Sampling |
Specifies whether the Profiler CPU-time sampling is activated. Sampling can reduce dramatically the number of monitored events whereby it achieves nearly the same CPU-time results. See Sampling. Default: |
|
| On | Activate sampling. | |
| Off | Deactivate sampling. | |
| Interval | integer > 0 |
The sampling interval determines at which CPU timestamps events are collected. If the sampling interval is greater, fewer events are collected. If the sampling interval is smaller, the resulting CPU times are more accurate. Unit: microseconds Default: |
| Wait-Full | integer > 0 |
Specifies how long the trace session waits if the Profiler data
pool is full. If the limit is reached and there is still no space released,
Natural terminates ( The value prevents the trace session from endless waiting on an unexpectedly failed monitor session. Unit: Seconds Default: |
| Wait-Empty | integer ≥ 0 |
Specifies how long the Profiler monitor session waits if the Profiler data pool is empty and the trace session is still active. If the limit is reached, a message is written and the profiling is stopped. A value of 0 means that the Profiler waits without limit. A positive value prevents the monitor session from endless waiting on a potentially faulty trace session. Unit: Seconds Default: |
| CMPRMIN | data set name |
Specifies the name of the dynamic parameter input data set for the Profiler monitor session. See Monitor Session CMPRMIN. Default: |
| Trace-Event | Specifies whether the Profiler event trace is
written to the batch output of the Profiler monitor session
(MONPRINT data set). See
Event
Trace.
Default: |
|
| On | Write the Profiler event trace. | |
| Off | Do not write the Profiler event trace. | |
| Trace-Monitor | 0-10 |
Set the level of the internal trace of the Profiler monitor
session. The internal trace contains information such as Profiler errors and is
written to the batch output of the monitor session ( Default: |
* Initialize Profiling
FUNCTION=INIT           /* Initialize Profiling
  RESOURCE=ON           /* Write to resource on/off
  RESOURCE-NAME='Test'  /* Resource name
  RESOURCE-LIB=PRFDATA  /* Resource library
  REPLACE=YES           /* Replace resource yes/no
  SAMPLING=ON           /* Use sampling on/off
  INTERVAL=100          /* sampling interval
  WAIT-FULL=60          /* Wait sec if pool full
  WAIT-EMPTY=60         /* Wait sec if pool empty
  CMPRMIN=PRFPARMS      /* CMPRMIN for monitor session
  TRACE-EVENT=ON        /* Event trace on/off
  TRACE-MON=3           /* Trace level monitor session
The Profiler utility in batch offers the following interfaces for starting or pausing the data collection:
Profiler Functions
Profiler Delivered Programs
Application Programming Interface
The Profiler must be initialized before the data collection can be started or paused. Because the data collection is paused after the initialization, it has to be started in any way so that event data is recorded.
This section covers the following topics:
![]() To start the data collection
To start the data collection
Enter the following Profiler keyword:
FUNCTION=START
![]() To pause the data collection
To pause the data collection
Enter the following Profiler keyword:
FUNCTION=PAUSE
Note:
There are no specific keywords associated to the
PAUSE function.
After the FUNCTION=START entry, lines with the following
keywords specific to the START function can be entered:
| Keyword | Value | Description |
|---|---|---|
| Count | integer ≥ 0 | Set the event counter of the next monitored event to the specified value. The event counter remains unchanged if a value of “0” is specified. Default: 0 |
The following Natural programs are delivered on the
SYSPRFLR library:
| Program | Description |
|---|---|
| PRFSTART | Start the data collection. |
| PRFPAUSE | Pause the data collection. |
| PRFSTATE | Get the state of the data collection. |
| PRFFCT | Execute a Profiler function:
START, PAUSE, STATE.
|
![]() To use Profiler delivered programs
To use Profiler delivered programs
Copy the programs to the library SYSTEM, to the
appropriate steplib library, or to the required library. If PRFFCT
is used, the application programming interface USR8210N has to be
copied as well (see next section). If PRFFCT is used in a
client/server environment, copy PRFFCT to the client library and
USR8210N to the server library.
Note:PRFFCT expects as input the value
Start, Pause or State to perform the
corresponding function.
![]() To start the data collection
To start the data collection
Execute the following program:
PRFSTART
Or:
PRFFCT
Start
![]() To pause the data collection
To pause the data collection
Execute the following program:
PRFPAUSE
Or:
PRFFCT
Pause
![]() To retrieve the current state of the data collection
To retrieve the current state of the data collection
Execute the following program:
PRFSTATE
Or:
PRFFCT
State
The data collection can be started and paused from the profiled Natural
application by calling the application programming interface (API)
USR8210N. The API can also be used to get the current state of the
monitoring process. The API is delivered in the SYSEXT library.
For more information, see SYSEXT Utility - Natural Application
Programming Interfaces.
![]() To use the API
To use the API
Copy the subprogram USR8210N to the library
SYSTEM, to the appropriate steplib library, or to the required
library.
Note:USR8210N expects as first parameter the value
Start, Pause or State to perform the
corresponding function. On return, P-RETURN contains the return
code and P-MESSAGE the success or error message.
![]() To start the data collection
To start the data collection
Use the interface with the CALLNAT statement:
CALLNAT 'USR8210N' 'Start' P-RETURN P-MESSAGE /* Start Profiler
![]() To pause the data collection
To pause the data collection
Use the interface with the CALLNAT statement:
CALLNAT 'USR8210N' 'Pause' P-RETURN P-MESSAGE /* Pause Profiler
![]() To retrieve the current state of the data collection
To retrieve the current state of the data collection
Use the interface with the CALLNAT statement:
CALLNAT 'USR8210N' 'State' P-RETURN P-MESSAGE /* Get Profiler state
The state is coded in the field P-RETURN:
| P-RETURN | Description |
|---|---|
| 0 | Natural Profiler data collection is started. |
| 1 | Natural Profiler data collection is paused. |
Filters play an important role in reducing the amount of collected data. In this section, we describe how to enable and use filters and give an overview on keywords available for a specific filter. Note that the Profiler must be initialized before any settings can be applied to a specific filter. The following filters are available:
The Profiler event filter specifies which events are collected. Additionally, it determines whether event data is recorded while Natural system programs are executing. By default (if the event filter is not specified) all events except the Natural statement events are collected and event data of Natural system programs is not recorded.
![]() To enable the event filter
To enable the event filter
Enter the following Profiler keyword:
FILTER=EVENT
After the FILTER=EVENT entry, lines with the following
keywords specific to the event filter can be entered:
| Keyword | Value | Description |
|---|---|---|
| Event |
Specifies which events are collected. Default: |
|
| [event][ event]… |
Each event is encoded by a one or two letter code. Multiple events are separated by blanks. Only the specified events are recorded. If no event is given, the Profiler monitors only the session and pause events. Possible event entries are: Notes
|
|
| ALL |
All events are recorded; that is, the definition is equivalent to EVENT=DB DA PL PS PT PR IB IA E CB CA U RS RI RO Caution: |
|
| Statement |
Specifies whether Natural statement ( Default: |
|
| On | Natural statement (NS) events are
collected but not counted. Only non-statement events are counted. Natural
statement events receive the same count as the preceding event.
|
|
| Off | Natural statement (NS) events are
not collected.
|
|
| Count |
Natural statement ( |
|
| FNAT |
Specifies whether event data is recorded while Natural system programs are executing. Default: |
|
| On | Event data is recorded while Natural system programs are executing. | |
| Off | Event data is not recorded while Natural system programs are executing. |
* Set event filter
FILTER=EVENT            /* Set event filter
  EVENT=D PS PR         /* Database and program start/resume events
  STATEMENT=ON          /* Collect statements (no count)
  FNAT=OFF              /* No FNAT
The Profiler program filter specifies the libraries, programs (Natural objects) and program lines for which event data is collected. By default (if the program filter is not specified) the data of all libraries, programs and lines is collected.
![]() To enable the program filter
To enable the program filter
Enter the following Profiler keyword:
FILTER=PROGRAM
After the FILTER=PROGRAM entry, lines with the following
keywords specific to the program filter can be entered:
| Keyword | Value | Description |
|---|---|---|
| Library | library |
Only the specified library is
monitored. If the specification ends with an asterisk ( Default: all libraries |
| Program | program |
Only the specified program is
monitored. If the specification ends with an asterisk ( Default: all programs |
| Line-From | number ≥ 0 |
Only lines with a line number greater or equal the specified number are monitored. Default: 0 (no restriction) |
| Line-To | number ≥ 0 |
Only lines with a line number less or equal the specified number are monitored. If the number is 0, the maximum line number is used. Default: 0 (no restriction) |
The following example monitors the lines 0500 to
2000 in all Natural objects starting with “X” on the library
PRFDEMO.
* Set program filter
FILTER=PROGRAM            /* Set program filter
  LIBRARY=PRFDEMO         /* Monitored library
  PROGRAM=X*              /* Monitored program
  LINE-FROM=500           /* 0 = min
  LINE-TO=2000            /* 0 = max
The Profiler count filter specifies the event counters for which data is collected. By default (if the count filter is not specified) the data of any event count is collected.
If the event filter STATEMENT=ON is set, the count filter
can only refer to non-statement events because statement events do not get a
unique count. The non-statement events have the same count as with
STATEMENT=OFF and the same count filter can be used in both
cases.
![]() To enable the count filter
To enable the count filter
Enter the following Profiler keyword:
FILTER=COUNT
After the FILTER=COUNT entry, lines with the following
keywords specific to the count filter can be entered:
| Keyword | Value | Description |
|---|---|---|
| From | number ≥ 0 |
Only events with an event counter greater or equal the specified number are monitored. Default: 0 (no restriction) |
| To | number ≥ 0 |
Only events with an event counter less or equal the specified number are monitored. If the number is 0, the maximum event counter is used. Default: 0 (no restriction) |
A profiling with STATEMENT=OFF has shown that a lot of CPU
time was spent between the events with the counters 1200 to 1400. Now, we want
to analyze this range in more detail including the statements. With
STATEMENT=COUNT, the statements would be counted as well and the
events would receive other counter values. But with STATEMENT=ON
the statements are not counted and the counter values can be used to restrict
the data collection.
* Set count filter
FILTER=COUNT            /* Set count filter (sec/100)
  FROM=1200             /* 0 = min
  TO=1400               /* 0 = max
The Profiler time filter specifies the CPU-times (in units of 1/100 sec) for which data is collected. By default (if the time filter is not specified) the data of any CPU-time is collected.
![]() To enable the time filter
To enable the time filter
Enter the following Profiler keyword:
FILTER=TIME
After the FILTER=TIME entry, lines with the following
keywords specific to the time filter can be entered:
| Keyword | Value | Description |
|---|---|---|
| From | number ≥ 0 |
Only lines with a CPU-time greater or equal the given number of sec/100 are monitored. Default: 0 (no restriction) |
| To | number ≥ 0 |
Only lines with a CPU-time less or equal the given number of sec/100 are monitored. If the number is 0, the maximum CPU-time is used. Default: 0 (no restriction) |
The following example monitors all events which occur after one second for the duration of two seconds.
* Set time filter
FILTER=TIME            /* Set time filter (sec/100)
  FROM=100             /* 0 = min
  TO=300               /* 0 = max
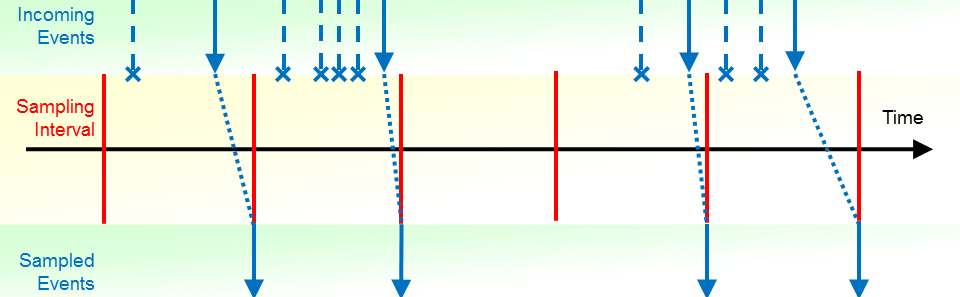
In general, profilers are classified into event based or statistical profilers. Statistical profilers, which operate by sampling, interrupt the operating system at regular intervals to receive the profiling data. The resulting data is not exact but a statistical approximation.
The Natural Profiler is an event-based profiler. It receives control and collects the profiling data whenever a Natural event occurs. Although the Natural Profiler does not interrupt the operating system, it offers a sampling technique that generates the same profiling data as statistical profilers. The Natural Profiler sampling works like a filter: it eliminates all events except the last one in a sampling interval. Additionally, it replaces the event CPU timestamp by the subsequent sampling time. Because the CPU-timestamp is taken at begin of an event, only those events remain that are active at a sampling interval threshold.
If you use Profiler sampling, please consider the following:
Natural Profiler sampling gives an estimation of the consumed CPU time. It does not give other estimations like hit counts, elapsed times, Adabas times, etc.
Natural Profiler sampling is a statistical approach which reduces the number of events severely with nearly the same CPU-time results.
The smaller the sampling interval, the more accurate the result.
The higher the sampling interval, the less data is produced.
The resulting event duration is a multiple of the sampling interval.
The sampling generates at most one record per sampling interval.
Events which spent more time than a sampling interval need one record only.
The session termination (ST) event is recorded
unchanged.
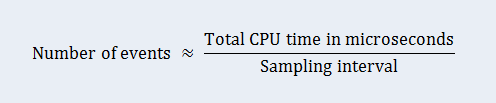
If the total application CPU time is known and sampling is used, the number of events can be estimated:
![]() To enable sampling
To enable sampling
Enter the following keywords specific to the Profiler
INIT function:
SAMPLING=ON
INTERVAL=nnn
where nnn is the sampling interval in microseconds.
Note:
By default (if SAMPLING is not specified) the data is
not sampled. If SAMPLING=ON is specified but no
INTERVAL, the default sampling interval is 100
microseconds.
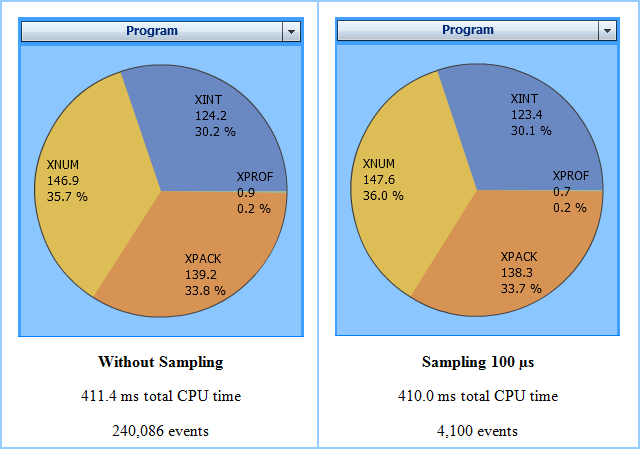
In the following example application, the program XPROF
calls three subprograms. The application is profiled twice:
Without sampling.
With sampling whereby a sampling interval of 100 microseconds is used.
For sampling, the following keywords are specified with the
INIT function:
FUNCTION=INIT            /* Initialize Profiling
  SAMPLING=ON            /* Use sampling
  INTERVAL=100           /* microseconds
The pie charts below shows for each program the name of the program, the CPU time spent (in units of milliseconds) and the CPU time percentage with respect to the total CPU time. The left chart reflects the run without sampling and the right chart the run with sampling. Although the number of events has been reduced by the sampling to about 1.7%, the resulting CPU time and distribution are nearly the same.
A user-defined event can be generated from a Natural program by using the Natural statement
CALL 'CMRDC' 'U' USER-DATA
For details see User-defined Events in the SYSRDC Utility documentation.
Notes:
![]() To write a user-defined event
To write a user-defined event
Enter the following Profiler keyword:
FUNCTION=TEXT
After the FUNCTION=TEXT entry, lines with the following
keywords specific to the TEXT function can be entered:
| Keyword | Value | Description |
|---|---|---|
| TEXT | text |
The text is added to the Profiler trace
as user-defined event. If multiple Default: none (blanks) |
| TYPE | character |
The alpha-numeric character specifies the subtype of the user-defined event. The subtype is the second character of the event type's letter code. The first character is always "U". Default: blank |
If only the user-defined events written by the TEXT
function are to be monitored, use the following event filter setting.
Additionally, the session and the pause events are monitored. All other events,
including user-defined events written by calls to CMRDC are
filtered out.
* Set event filter
FILTER=EVENT/* Set event filter
  EVENT=                /* No events
  STATEMENT=OFF         /* No statements
  FNAT=OFF              /* No FNAT
The following example writes a user-defined event with type “UJ” and the text “Start profiling” into the Profiler event trace.
* Write a user-defined event
FUNCTION=TEXT            /* Write a user-defined event
  TEXT='Start profiling' /* Event text
  TYPE='J'               /* Event subtype
The Profiler utility can write a Profiler event trace to the batch
output of the Profiler monitor session (MONPRINT data set).
![]() To enable the event trace
To enable the event trace
Enter the following keyword specific to the Profiler
INIT function:
TRACE-EVENT=ON
Note:
By default (if TRACE-EVENT is not specified), no
Profiler event trace is written to the batch output.
The Profiler event trace contains the following data:
| Column | Description |
|---|---|
| Count | Event count |
| Time |
Event time Unit: hour:minute:second.microseconds |
| CPU-Time |
Session CPU time Unit: microseconds |
| Ev | Event type; see Events. |
| Lev | Program level |
| Library | Program library |
| Program | Program (Natural object) name |
| Line | Line number of program statement executed |
| CC-Lib | Copycode library (if copycode is active) |
| CC-Name | Copycode name (if copycode is active) |
| Statement | Natural statement currently executed. For technical reasons, there is no one-to-one relationship between a Natural source code statement and an object code in the cataloged object. Therefore, the statements listed in the Profiler event trace can differ from the statements in the source. |
| Local-Data | Event-specific data like Adabas DBID/FNR. |
To enable the event trace, the following keyword is specified with the
INIT function:
* Initialize Profiling
FUNCTION=INIT               /* Initialize Profiling
  TRACE-EVENT=ON            /* Write event trace
The event trace is written to the batch output of the Profiler monitor
session (MONPRINT data set):
Count Time              CPU-Time (ms) Ev Lev Library  Program  Line CC-Lib   CC-Name  Statement  Local-Data
    0 17:38:17.200951          42.324 MP 003 SYSPRFLR PRBINIT  8370                   Call       Monitor pause requested
    0 17:38:17.204508          43.471 MP 003 SYSPRFLR PRBSTART 1760                   Call       Start of block filter
   11 17:38:17.218379          48.874 DB 000                   0000                              00010/00032 S1
   12 17:38:17.218941          48.897 DA 000                   0000                              00010/00032 S1   Rsp: 0
   13 17:38:17.218944          48.910 PL 000                   0000                              Execute PRFDEMO/XPROF
   14 17:38:17.218945          48.916 PS 001 PRFDEMO  XPROF    0000                   PgmStart   00010/00032 Type: P
   15 17:38:17.218956          48.979 IB 001 PRFDEMO  XPROF    0300                   Input      Out: 133 In: 0
   16 17:38:17.219235          49.046 IA 001 PRFDEMO  XPROF    0300                   Input      Out: 133 In: 80
   17 17:38:17.219258          49.182 DB 001 PRFDEMO  XPROF    0370                   Callnat    00010/00032 S1
   18 17:38:17.220426          49.211 DA 001 PRFDEMO  XPROF    0370                   Callnat    00010/00032 S1   Rsp: 0
   19 17:38:17.220427          49.216 DB 001 PRFDEMO  XPROF    0370                   Callnat    00010/00032 S1
   20 17:38:17.221178          49.242 DA 001 PRFDEMO  XPROF    0370                   Callnat    00010/00032 S1   Rsp: 0
   21 17:38:17.221181          49.255 PL 001 PRFDEMO  XPROF    0370                   Callnat    Callnat PRFDEMO/XINT
   22 17:38:17.221183          49.262 PS 002 PRFDEMO  XINT     0000                   PgmStart   00010/00032 Type: N
   23 17:38:17.225734          77.214 PT 002 PRFDEMO  XINT     0240                   End        00010/00032 Type: N
   24 17:38:17.225734          77.214 PR 001 PRFDEMO  XPROF    0370                   Callnat
   25 17:38:17.225740          77.246 DB 001 PRFDEMO  XPROF    0400                   Callnat    00010/00032 S1
   26 17:38:17.226356          77.274 DA 001 PRFDEMO  XPROF    0400                   Callnat    00010/00032 S1   Rsp: 0
   27 17:38:17.226358          77.279 DB 001 PRFDEMO  XPROF    0400                   Callnat    00010/00032 S1
   28 17:38:17.226971          77.296 DA 001 PRFDEMO  XPROF    0400                   Callnat    00010/00032 S1   Rsp: 0
   29 17:38:17.226973          77.308 PL 001 PRFDEMO  XPROF    0400                   Callnat    Callnat PRFDEMO/XNUM
The Profiler internal trace writes Profiler messages to the batch output. The trace can be activated for the Profiler trace session and/or the Profiler monitor sessions, each producing its own output.
![]() To activate the Profiler internal trace for the Profiler trace
session
To activate the Profiler internal trace for the Profiler trace
session
Enter the following Profiler keyword:
TRACE=n
where n is the trace level (see Trace Levels).
Note:
By default (if TRACE is not specified), trace level 2
(warnings) is used. The trace is activated as soon as the TRACE
keyword is specified. It is therefore recommended to specify the
TRACE keyword as soon as possible. If you execute the Profiler
utility multiple times in the job, you need to specify the TRACE
keyword with each execution.
![]() To activate the Profiler internal trace for the Profiler monitor
session
To activate the Profiler internal trace for the Profiler monitor
session
Enter the following keyword specific to the Profiler
INIT function:
TRACE-Monitor=n
where n is the trace level (see Trace Levels).
Note:
By default (if Trace-Monitor is not specified), trace
level 3 (statistics) is used.
The trace levels used by the Profiler trace and monitor sessions are listed in the table below. In general, a higher trace level also contains the information of the lower trace levels. For example, if you select trace level 3 (statistics), error messages and warnings are also logged.
It is recommended that you use at least trace level 2 (warning) so that error messages and warnings are logged. For the Profiler monitor session, trace level 3 (statistics) is a good choice. It prints the statistics of the Profiler run (see Profiler Statistics). Higher trace levels for the monitor session can be extremely verbose and the output can be mixed up with the event trace (if activated).
| Level | Name | Description |
|---|---|---|
| 0 | No trace | Profiler internal trace is deactivated. |
| 1 | Error | Log error messages. |
| 2 | Warning | Log warnings. |
| 3 | Statistics |
Trace session: Print the values used for the Monitor session: Print the Profiler Statistics. |
| 4 | Function | Log messages for the used Profiler keywords
(FUNCTION, FILTER, etc.).
|
| 5 | Block | Monitor session: Print the statistics of each data block written to the Profiler resource file. |
| 6 | Details | Log detailed information. |
| 7 | Not used. | |
| 8 | Not used. | |
| 9 | Not used. | |
| 10 | Internal | Internal usage. |
In the following example, the Profiler internal trace is set to "4” (function) for the trace session and to “5” (block) for the monitor session.
* Set Profiler internal trace for trace session
TRACE=4                     /* Trace session trace level
* Initialize Profiling
FUNCTION=INIT               /* Initialize Profiling
  TRACE-MON=5               /* Monitor session trace level
The output of the Profiler trace session for trace level 4:
PRBMAIN : Profiler trace level: 4
PRBMAIN : Profiler On-Error: Terminate
***************************************************************************
* 15:45:14          ***** NATURAL PROFILER UTILITY *****         2014-12-17
* User SAGPRFD1               - Function INIT -                     PRBINIT
*
* Keyword              Value
* -------------------- ----------------------------------------------------
* Resource             ON
* Resource-Lib         SAGPROF
* Resource-Name        Test01.nprf
* Replace              Y
* Wait-Full            60
* Wait-Empty           60
* Sampling             OFF
* Trace-Monitor        5
* Trace-Event          OFF
* -------------------- ----------------------------------------------------
***************************************************************************
PRBINIT : Profiler INIT function - Start monitor session.
PRBINIT : Profiler INIT function - Monitor session started. Time: 1.0 sec.
PRBINIT : Set trace session Id ...: 0000000000000001
PRBINIT : Set monitor session Id .: 0000000100000000
PRBINIT : Trace session successfully initialized.
PRBFEVEN: Event filter: SI ST DB DA PL PS PT PR IB IA E CB CA U RS RI RO NS
PRBSTART: Profiling started.
PRBMAIN : Profiler - End of input.
***************************************************************************
...
Output of the application
...
The output of the monitor session for trace level 5:
***************************************************************************
* 15:45:14          ***** NATURAL PROFILER UTILITY *****         2014-12-17
* User SAGPRFD1           - Monitor Session Input -                  PRBMON
*
* Keyword              Value
* -------------------- ----------------------------------------------------
* Resource             Test01.nprf
* Resource-Lib         SAGPROF
* Replace              Y
* Wait-Full            60
* Wait-Empty           60
* Sampling Interval    0
* Trace-Monitor        5
* Trace-Event          OFF
* -------------------- ----------------------------------------------------
***************************************************************************
PRBALLOC: Resource Test01.nprf created in library SAGPROF (10,32)
PRBMON  : Monitor session Id: 0000000100000000
PRBMON  : Init Options: Init=Pause DataPoolSize=0 Sessions=1 WaitFull=60 MonitorVersion=1
PRBMON  : Application profiling environment initialized. Monitor v1 RDC1 v1
PRBMON  : No sampling.
Block: 1 Type: E Block length: 4984 Data length: 4972 Events: 151 Last: 93
Block: 2 Type: E Block length: 4968 Data length: 4956 Events: 216 Last: 93
Block: 3 Type: E Block length: 4976 Data length: 4964 Events: 216 Last: 93
Block: 4 Type: E Block length: 4974 Data length: 4962 Events: 216 Last: 93
Block: 5 Type: E Block length: 4981 Data length: 4969 Events: 216 Last: 93
Block: 6 Type: E Block length: 4976 Data length: 4964 Events: 216 Last: 93
Block: 7 Type: E Block length: 1448 Data length: 1436 Events: 46 Last: 102
PRBMON  : Monitor session data collection ended at 2014-12-17 15:45:15.7
Block: 8 Type: P Block length: 784 Data length: 772 Properties: 71 Highest: 82
***************************************************************************
...
Profiler Statistics
...
In addition to event data, the Profiler collects statistical data which is written to the Profiler resource file. The Profiler statistics can also be written to the trace output of the Profiler monitor session.
![]() To write the Profiler statistics
To write the Profiler statistics
Enter the following keyword specific to the Profiler
INIT function:
TRACE-Monitor=3
or a higher trace level (see Trace Levels). Trace level 3 is also the default level for the Profiler monitor session.
The Profiler statistical data is displayed in categories combining properties of a similar type. The following categories are available:
Display environment and Natural Profiler related information.
Note:
The properties listed below and in subsequent sections are the
properties provided by the Profiler in all environments. The Profiler
Statistics contains only the properties that are relevant for the current run.
Therefore, not all of the properties listed below are displayed in every
case.
| Property | Unit | Description |
|---|---|---|
| Machine class | The name of the machine class on which the Natural application is running. | |
| Environment | The environment in which the Natural application is running, in general “NaturalONE”, “Batch” or “RPC”. | |
| User | The ID of the user running the application (value of
*USER). For a mainframe batch job, it can contain the name of the
job.
|
|
| Profiler version |
The version of the Profiler. NaturalONE environment: The version of the Profiler on the server. |
|
| Profiler revision | vvrr.xxx | The Profiler revision is build up by the Natural version and the last Profiler correction number. |
| Profiler revision date | yyyy-mm-dd hh:ii | The date and time when Profiler revision was created. |
| Profiler client version | NaturalONE environment: The version of the Profiler client. | |
| Profiler trace library | NaturalONE environment: The name of the Natural library containing the Profiler internal trace and the Profiler event trace. | |
| Profiler trace level | The level of the Profiler internal trace. | |
| Profiler trace member | NaturalONE environment: The name of the Natural text member containing the Profiler internal trace. | |
| Profiler event trace | Indicates whether the Profiler event trace was activated
(ON/OFF).
|
|
| Profiler event trace member | NaturalONE environment: The name of the Natural text member containing the Profiler event trace. | |
| Utility trace level | NaturalONE environment: The Natural utilities trace level. |
Display Profiler resource file related information.
| Property | Unit | Description |
|---|---|---|
| Resource name | The name of the Natural Profiler resource file. | |
| Resource type | The type of the Natural Profiler resource file. In general "Natural Profiler Resource File" (nprf). | |
| Resource short name | Mainframe: The short name of the Natural Profiler resource file. | |
| Resource library | The name of the Natural library containing the Natural Profiler resource file. | |
| Resource DBID | The database ID of the Natural library containing the Natural Profiler resource file. | |
| Resource FNR | The file number of the Natural library containing the Natural Profiler resource file. | |
| Resource allocation date | yyyy-mm-dd hh:ii:ss.t | The date and time when the Natural Profiler resource file was allocated. |
| Resource size | bytes | The size of the Natural Profiler resource file. It comprises the resource headers, the event data and the properties. The resource size is calculated regardless whether the resource is allocated or not. |
| Resource block size | bytes | The maximum size of a resource block. A resource block consists of a resource block header and a data block. |
Display statistics of the Profiler monitor session.
| Property | Unit | Description |
|---|---|---|
| Monitor start time | yyyy-mm-dd hh:ii:ss.t | The date and time when the monitor session started. |
| Monitor end time | yyyy-mm-dd hh:ii:ss.t | The date and time when the monitor session ended. |
| Monitor elapsed time | sec | The total elapsed time consumed by the monitor session. |
Display statistics of the Profiler trace session. The Profiler trace session includes also the application execution.
| Property | Unit | Description |
|---|---|---|
| Trace start time | hh:ii:ss.microsec | The start time of the tracing. With NaturalONE
this is the time of the SI (session initialization) event. In
batch, the session is already initialized when the monitoring starts. Therefore
the start time is the time of the first event (usually a monitor pause
event).
|
| Trace end time | hh:ii:ss.microsec | The end time of the tracing. This is in general
the time of the ST (session termination) event.
|
| Trace elapsed time | sec | The elapsed time consumed by the trace session from the start time to the end time. |
| Application CPU time | ms | The total CPU time consumed by the application. |
| Monitor CPU time | ms | The total CPU time consumed by the Natural data collector. This time is not measured by the Natural LUW server. |
| Total CPU time | ms | The total CPU time consumed by the trace session. It is the sum of the application CPU time and the monitor CPU time. |
| Sampling interval | microsec | The sampling interval time (CPU time in microseconds). A value "0" means that no sampling was active. |
| Data pool empty | The number of Profiler read requests which found the Profiler data pool empty (and a session active). | |
| Data pool empty after full | The number of Profiler read requests which found the Profiler data pool empty although it was full before. If this counter is greater than 0, the Profiler data pool is too small which leads to a poor performance. | |
| Data pool overflow | The number of data pool overflows (with data lost). Data pool overflows should no longer happen. The counter is there for historical reasons (version 3 and below). | |
| No session active | The number of read requests which found the Profiler data pool empty and no trace session active. This can only happen for Profiler read requests submitted before the session initialization or after the session termination. |
Display statistics of the data processing, compression and transfer.
| Property | Unit | Description |
|---|---|---|
| Number of events | The total number of events. | |
| Highest event number | The highest event number as given by the Natural data collector. Note that the Natural data collector counts only non-statement events when called from NaturalONE. In batch it depends on the statement filter whether statement events are counted or not. | |
| Number of data blocks | The number of event data blocks send to NaturalONE or written to the resource. | |
| Utility buffer size | bytes | The size of a utility buffer used for the transfer from the client to the server. In general the buffer contains the header information and the function specific data. |
| Data block size | bytes | The maximum size available for event data in the utility buffer. This is the maximum amount of data which can be transferred from the server to the client in one call. If the Profiler runs in batch mode, it uses the same data block size for storing the data in the resource file. |
| RDC data length | bytes | The total size of the data received from the Natural data collector. |
| Uncompressed data length | bytes | The total size of the Profiler data in uncompressed format. |
| Compressed data length | bytes | The total size of the compressed data as send to NaturalONE or written to the resource. |
| Identical bytes trimmed left | The number of identical bytes trimmed left at the forward data compression. | |
| Blanks trimmed right | The number of blanks trimmed right at the backward data compression. | |
| Compression header length | bytes | The total size of the compression headers saved with each compressed event record. |
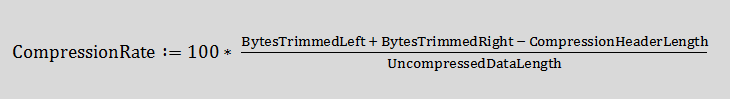
| Compression rate | percent | The percentage of the data reduction by the compression. The higher the compression rate, the less data has to be transferred or saved. The formula of the compression rate is described below. |
| Events/block | The average number of events contained in one event data block. | |
| Bytes/event | The average length in bytes of a compressed event data record. |
The compression rate is calculated by the following formula:
Display statistics of the event types.
| Property | Unit | Description |
|---|---|---|
| Unknown event | The number of unknown events. | |
| Session initialization | The number of session initialization events. | |
| Session termination | The number of session termination events. | |
| Program load | The number of program load events. | |
| Program start | The number of program start events. | |
| Program termination | The number of program termination events. | |
| Program resume | The number of program resume events. | |
| Before database call | The number of before database call events. | |
| After database call | The number of after database call events. | |
| Before terminal I/O | The number of before terminal I/O events. | |
| After terminal I/O | The number of after terminal I/O events. | |
| Before external program call | The number of before external program call events. | |
| After external program call | The number of after external program call events. | |
| Runtime error | The number of runtime error events. | |
| Statement trace | The number of statement trace events. For technical reasons, multiple Natural statements on the mainframe can be merged into one statement event and conversely, one Natural statement can cover multiple statement events. | |
| Outbound RPC message | The number of outbound RPC message events. | |
| Inbound RPC message | The number of inbound RPC message events. | |
| Start RPC request execution | The number of start of RPC request execution events. | |
| User trace call | The number of user-defined events. | |
| Monitor pause | The number of monitor pause events. | |
| Monitor filter | The number of monitor filter events. Filter events are not recorded. |
Display statistics of the types of the monitor pause events.
| Property | Unit | Description |
|---|---|---|
| Pause - unknown type | The number of monitor pause events with unknown pause type. | |
| Pause - requested | The number of requested monitor pause events. | |
| Pause - start of block filter | The number of monitor pause events caused by a start of a block filter (library, program, line, FNAT, event count or time filter). | |
| Pause - data pool full | The number of monitor pause events caused by a data pool full situation. | |
| Pause - data pool overflow | The number of monitor pause events caused by a data pool overflow situation. |
In general, Natural Profiler resource files can be maintained (copied, renamed or deleted) like any other Natural resource using Natural utilities (SYSMAIN), NaturalONE or Natural Studio.
If you delete or replace a big resource file, it can happen that you receive the following message.
Error – NAT3047
Maximum value for Adabas parameter NISNHQ was exceeded.
In this case, you have two options:
Contact your database administrator to increase the Adabas parameter
NISNHQ.
Use the Profiler DELETE function to perform a “dirty”
delete of the resource. This function does not delete the resource in one big
step but in chunks (with an end of transaction after each chunk). If the
DELETE function fails by any reason, you need to repeat it to get
rid of inconsistent data.
![]() To delete a Profiler resource file
To delete a Profiler resource file
Enter the following Profiler keyword:
FUNCTION=DELETE
It is recommended to execute the Profiler DELETE
function in a separate job or step, with the following Natural profile
parameter setting:
RDCSIZE=0
After the FUNCTION=DELETE entry, lines with the following
keywords specific to the DELETE function can be entered:
| Keyword | Value | Description |
|---|---|---|
| Resource-Name | resource |
The name of the Profiler resource file to be deleted. Possible
extensions are Default: none |
| Resource-Lib | library |
The name of the Natural library in which the resource resides. Default: where |
* Delete a Profiler resource file
FUNCTION=DELETE         /* Delete a Profiler resource file
  RESOURCE-NAME='Test'  /* Resource name
  RESOURCE-LIB=PRFDATA  /* Resource library
By default, the Profiler monitor session uses the same dynamic Natural
parameters as the trace session specified with the CMPRMIN input
data set. With the CMPRMIN keyword of the Profiler
INIT function a separate dynamic parameter input data set can be
defined for the Profiler monitor session. If you use the separate dynamic
parameter input data set, please consider the following:
Specify for the monitor session only those Natural parameters which
are required. Do not specify parameters required for the application execution
(such as RPC).
Specify the RDCSIZE and RDCEXIT parameters
only for the trace session. Specifying these parameters for the monitor session
will lead to unnecessary calls to the exit and a poorer performance.
Specify the PDPSIZE parameter only for the monitor
session. Any specification in the trace session dynamic parameter input data
set is ignored.
If the default Natural profile parameter ETID setting is
used, it can happen that the following error is received by the Profiler
monitor session:
NAT3048 Error during Open processing. DB/Subcode nn/8 – ETID=jobname.
In this case use the following parameters for CMPRMIN:
ETID=' ',DBCLOSE=ON
Alternatively, you can use an ETID value different from the
job name in the separate dynamic parameter input data set for the Profiler
monitor session.
![]() To define a dynamic parameter input data set for the Profiler monitor
session
To define a dynamic parameter input data set for the Profiler monitor
session
Enter the following keyword specific to the Profiler
INIT function:
CMPRMIN=dataset
where dataset is the name of the dynamic parameter input data set for the Profiler monitor session.
//CMSYNIN  DD  *
PROFILER
FUNCTION=INIT             /* Initialize profiling
  CMPRMIN=PRFPARMS        /* Monitor session parameter
  ...
/*
//* Trace Session Parameters
//CMPRMIN  DD   *
RDCSIZE=2,RDCEXIT=NATRDC1,...
/*
//* Monitor Session Parameters
//PRFPARMS DD   *
ETID=PROFILER,PDPSIZE=10000,...
/*
Profiling an application usually impacts the performance of the application. The impact can concern the measurement and the overall job duration. The Natural Profiler has implemented several features to keep the measurement as accurate and the performance loss as low as possible.
The Profiler monitor session, which reads the data from the Profiler data pool and writes it into the Profiler resource file, is running as an as asynchronous task. The time spent for the monitor session is therefore not taken into account for the application time measurement. Nevertheless, because the Profiler trace session has to wait at the end until the monitor session has finished, it can impact the overall job duration.
The NATRDC1 exit running in the Profiler trace session measures the CPU time needed for the assembling of the trace record separately and subtracts it from the session CPU time.
If Natural statement events are collected with the event filter
setting STATEMENT=ON, the Profiler disables the statement event
generation in the Natural nucleus as long as any block filter (library,
program, line, FNAT, event count or time filter) is active. This reduces the
load on the Natural nucleus, the SYSRDC data collector and finally on NATRDC1
which would otherwise reject the event.
The Profiler compresses the event data before it writes it into the resource. Compression can save up to 80% of data storage which reduces the number of I/Os dramatically. The event data is also read by NaturalONE in the compressed format which increases the flow-rate.
When running on a z/OS machine with zIIP (IBM System z Integrated Information Processor), time is lost if execution switches from the general purpose processor to the zIIP and vice versa. If you use Natural zIIP with the Profiler, the NATRDC1 exit will run on the zIIP with a minimal number of switches.
If the Profiler data pool is full, the Profiler trace session waits one second so that the Profiler monitor session can read and release some space. If the data pool is too small, it can happen that the Profiler monitor session reads all data before the trace session is restarted. If the monitor session does not find data in the data pool, it waits one second for new data. Now both sessions wait alternating, which increases the overall job duration severely.
The Data pool empty after full property in the
Trace Session category of the Profiler statistics
indicates such alternating wait situations. If the value of this property is
greater 0, increase the Natural profile parameter PDPSIZE to an
appropriate value.
PDPSIZE=50000
Profiling a long running batch application can produce a huge amount of data, especially when Natural statements are monitored. This section describes how to minimize the number of events while still monitoring what matters. We cover the following strategies:
If the batch job starts multiple Natural applications then initialize and start the Profiler immediately before the first application of interest. As soon as the Profiler is initialized, it has an impact on the performance even if no events are collected.
Pause the Profiler for applications which are not of interest and restart it for the next application of interest.
Eventually use the application programming interface (API) to start and pause profiling at specific points in the application.
From the three applications executed, only the second is of interest. By embracing this application with appropriate Profiler statements you avoid the other applications to have an impact on performance:
APP-01
PROFILER
FUNCTION=INIT,...         /* Initialize profiling
FUNCTION=START            /* Start data collection
END-PROFILER              /* End Profiler input
APP-02
PROFILER
FUNCTION=PAUSE            /* Pause data collection
END-PROFILER              /* End Profiler input
APP-03
FIN
/*
Use the event filter FNAT=OFF to avoid monitoring
Natural system programs or do not specify the FNAT keyword at
all.
Statement events have the most impact on the performance and quantity. The other events have only a low impact on the performance but enlarge the quantity. Monitor statement events only if you really need them. Monitor from the non-statement events only those you want to analyze.
For example if you want to view in NaturalONE the program hot spots but neither the statement nor the line hot spots, the following Profiler event filter setting is sufficient:
FILTER=EVENT            /* Set event filter
  EVENT=P               /* Program events
With this setting, only the program events needed for the program hot spots are monitored, whereas statement and FNAT collection are deactivated by default.
Monitor only the libraries and programs that you want to analyze. Use program filter to restrict profiling.
For example if a (first) Profiler run without statement collection has shown that the most CPU time was spent in the program HIGHCPU then you might only want to know in which line of this program the most time was spent and which other events (database calls, external program calls, etc.) are performed:
FILTER=PROGRAM          /* Set program filter
  LIBRARY=PRFDEMO       /* Monitored library
  PROGRAM=HIGHCPU       /* Monitored program
FILTER=EVENT            /* Set event filter
  EVENT=ALL             /* All events
  STATEMENT=ON          /* Collect statements (no count)
For the CPU analysis of a long running application, it is recommended to consider sampling. If you use already filter settings to reduce the number of events, you can additionally activate sampling to reduce the number of events further.
Most event data is generated when statements are collected. Therefore, sampling will often be used in conjunction with statement collection. For very long running applications, however, it might be helpful to use sampling even if no statements are collected. If you use sampling without statement collection, it is recommended to use a greater sampling interval than otherwise.
Sampling has only restricted impact on the Profiler performance but it can reduce the amount of data dramatically. The formula in section Sampling rearranged here can be used to choose a sampling interval so that the number of events is equal to or less than an approximate value:
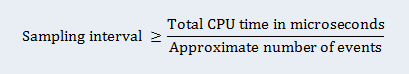
For example, a batch application requires 40 minutes CPU time (2,400,000,000 μ). Sampling should restrict the number of events to at most 500,000 events. The corresponding sampling interval can be calculated with the formula above.
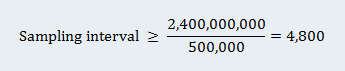
Specify the following sampling setting for the Profiler
INIT function:
SAMPLING=ON
INTERVAL=4800