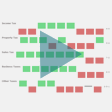
Sparkline win_loss
A Sparkline win_loss chart useful in displaying trends with respect to an origin line for one or more series (a column in the dataset) in a summary, highly compressed form with minimal highlights. One typical use is to display data points as win/loss/draw or profit/loss/break-even.
Each series displays a set of columns with respect to the origin line progressing in the order that records appear in the dataset. Highlights are shown for the number of wins (positive values), the number of draws (zeroes) and the number of losses (negative values).
Tip: The number of records determines how many bars appear on each line. For large numbers of records (> 50), you can use pagination with this chart to provide better visibility to bars.
For more information on using the Sparkline win_loss view, see
Characteristics and
Configure This View. For alternate formats, see
Sparkline Column and
Sparkline Column. You can also include sparkline win_loss
mini-charts for a column in a
Grid and KPIs View.