MashZone NextGen 10.2 | Appendix | Legacy Presto components | Mashables and Mashups | Views for Mashups and Mashables | Built-in MashZone NextGen Views | Pie Chart
 
Pie Chart
 
Characteristics
Configure This View
Pie Chart Video rectPie Chart Video
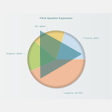
Pie charts display a single numeric data point for multiple records as percentages of a whole. The percentage is rendered as a "slice of pie" covering an arc within a circle. Pie charts are also similar to Doughnut Charts.
There are two possible relationships between a slice and the records in the data set:
*1-to-1 where each record represents one slice.
*Aggregated where an aggregate value of multiple records are shown as one slice.

Copyright © 2013-2018 | Software AG, Darmstadt, Germany and/or Software AG USA, Inc., Reston, VA, USA, and/or its subsidiaries and/or its affiliates and/or their licensors.
Innovation Release