MashZone NextGen 10.2 | Appendix | Legacy Presto components | Mashables and Mashups | Views for Mashups and Mashables | Built-in MashZone NextGen Views | Column Chart
 
Column Chart
 
Characteristics
Configure This View
Column Chart Video rectColumn Chart Video
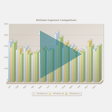
Column charts display numeric data points as vertical bars for a set of records. Columns can be rendered in two dimensions or three. Columns can also be stacked. For horizontal "bars", use the Bar Chart instead. For a reverse relationship between records and data points, see Sparkline Column.
There are two common patterns for data in bar and column charts:
*Numerical data distributed by a frequency, such as time intervals.
This is some times called a histogram. Although time is a common distribution, it isn't required. Any numeric distribution works.
*Numeric data sorted into categories, such as expense categories.
With categories, the order in which categories are presented is defined by the order it appears within results.

Copyright © 2013-2018 | Software AG, Darmstadt, Germany and/or Software AG USA, Inc., Reston, VA, USA, and/or its subsidiaries and/or its affiliates and/or their licensors.
Innovation Release