MashZone NextGen 10.2 | Appendix | Legacy Presto components | Mashables and Mashups | Views for Mashups and Mashables | Built-in MashZone NextGen Views | Bubble Chart
 
Bubble Chart
 
Characteristics
Configure This View
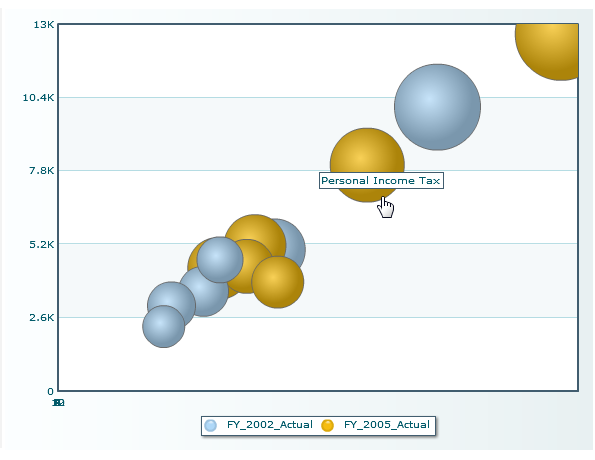
Bubble charts display numeric statistics plotted as discrete points on a grid and also indicate the importance or scale of each data point by the size of the bubble. Bubble chart views support desktop and mobile devices.
Bubble charts allow users to determine a pattern, if any, in the data and the scope or distribution of the data. Bubble charts are a variation of Scatter Charts.
Tip: For best results with bubble charts, limit the number of repeating items to be plotted to 30 or less.
You can plot more than one set of points in a bubble chart. See Characteristics and Configure This View for more information.

Copyright © 2013-2018 | Software AG, Darmstadt, Germany and/or Software AG USA, Inc., Reston, VA, USA, and/or its subsidiaries and/or its affiliates and/or their licensors.
Innovation Release