MashZone NextGen 10.2 | Appendix | Legacy Presto components | Mashables and Mashups | Views for Mashups and Mashables | Built-in MashZone NextGen Views | Area Chart
 
Area Chart
 
Characteristics
Configure This View
Area Chart Video rectArea Chart Video
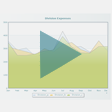
Area charts display numeric statistics for repeating data as a filled area below a line in a coordinate grid defined by X and Y axes. Areas can also be stacked. This view supports desktop and mobile devices.
Tip: Data can be somewhat obscured in an unstacked area chart when one data point is lower than the corresponding point for the top-most area. Consider a Line Chart or a Zoom Line Chart as an alternative.

Copyright © 2013-2018 | Software AG, Darmstadt, Germany and/or Software AG USA, Inc., Reston, VA, USA, and/or its subsidiaries and/or its affiliates and/or their licensors.
Innovation Release