MashZone NextGen 10.2 | Appendix | Legacy Presto components | Mashables and Mashups | Views for Mashups and Mashables | Built-in MashZone NextGen Views | Common Chart Techniques | Change the Series Plot to Column, Line or Area
 
Change the Series Plot to Column, Line or Area
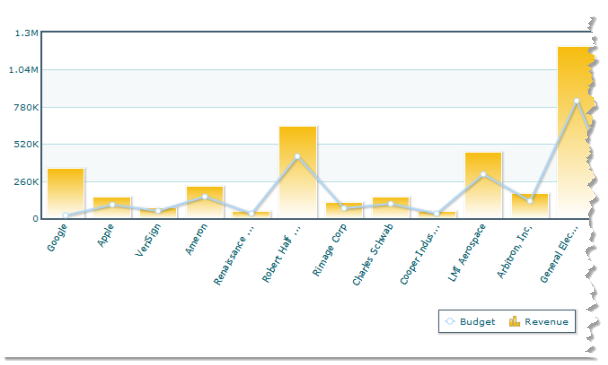
With some charts that can have multiple numeric series, you can choose to plot the data for each series in a different form, such as this combination Line and Column chart:
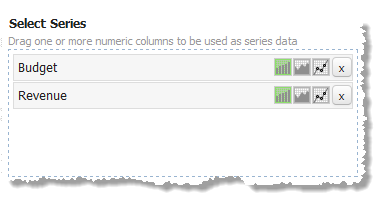
Simply click the column, area or lin button for that series:

Copyright © 2013-2018 | Software AG, Darmstadt, Germany and/or Software AG USA, Inc., Reston, VA, USA, and/or its subsidiaries and/or its affiliates and/or their licensors.
Innovation Release