Using stock charts
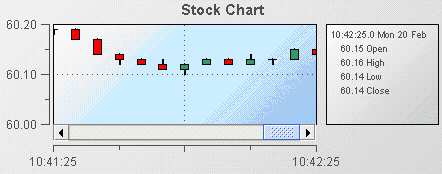
Stock charts provide the ability to view the Open, High, Low, and Close values (OHLC) for a scenario variable or DataView field such as stock price over set time intervals. The intervals may be small such as 5 seconds if being used for intra-day trading or larger for longer time periods such as hours, days, or weeks. The following illustration is from the Stock Chart tutorial sample.
In this example, the OHLC values are shown as a candlestick chart where each “stick” represents a 5 second interval. The stock chart supports others display formats such as OHLC, line, and bar.
1. Open the file tutorial-stock-chart.rtv by double-clicking Stock Chart on the tutorial main page.
2. Select the stock chart object and in the Object Properties panel, select the priceTraceType property and change its value to OHLC.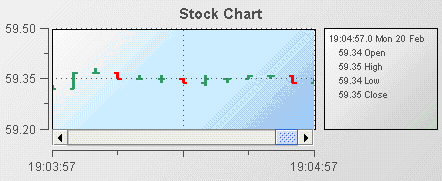
The data displayed is the same as that displayed in the previous illustration where priceTraceType was set to Candlestick. Only the presentation has changed.
Although named “stock chart” you are not limited to using it for stock data. You can chart Open, High, Low, and Close values for any scenario variable or DataView field. Other financial and non financial data can often benefit from being visualized as a stock chart.
Common tasks related to stock charts are covered in the following sections:
Detailed reference information on stock charts is provided in
Stock charts in the
Apama Dashboard Property Reference.
Copyright © 2013
Software AG, Darmstadt, Germany and/or Software AG USA Inc., Reston, VA, USA, and/or Terracotta Inc., San Francisco, CA, USA, and/or Software AG (Canada) Inc., Cambridge, Ontario, Canada, and/or, Software AG (UK) Ltd., Derby, United Kingdom, and/or Software A.G. (Israel) Ltd., Or-Yehuda, Israel and/or their licensors.