Adding overlays
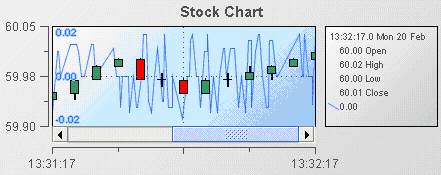
Stock charts support up to nine overlays. An overlay is much like a trace in a trend chart. Overlays can be used to compare the displayed OHLC values against other variables or fields such as other stock prices, overall activity on the stock index, or to show periodic events such as stock splits and earnings announcements. The following illustration is from the Stock Chart Overlays tutorial sample.
Here the overlay is showing the velocity of the stock price. Notice that multiple scales are shown on the Y axis; the outer scale corresponds to the stock price and the inner scale the velocity.
1. Open the file tutorial-stock-overlay.rtv by selecting Stock Chart Overlays on the tutorial main page.
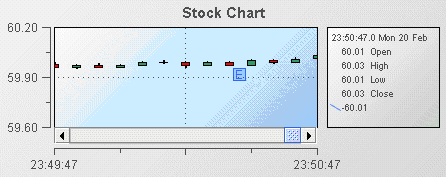
2. Select the stock chart and in the Object Properties panel, select the property overlay1Type and change its value to Bar.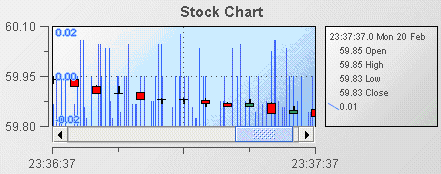
The overlay values are now displayed as discrete bars and not as a single line.
If you set overlay1Type to Event, event markers will be placed on the chart at the occurrence of each event. This allows you to easily identify when key events occurred. The following illustration demonstrates this.
The character displayed in event markers is the first letter of the corresponding overlayNLabel property.
When using overlays to display event markers, the event markers should be relatively sparse. Displaying high numbers of event markers will cause them to overlap and limit their usefulness.
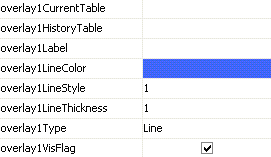
To add overlays to a stock chart, set the overlayCount property to the number of overlays to be displayed. This will cause a set of properties to be added to the property panel for each overlay; overlay1 through overlayN. Following are the properties for overlay 1.
When you attach an overlay to a scenario OHLC table or a scenario trend table, use the properties OverlaynCurrentTable and OverlaynHistoryTable.
Use only the OverlaynCurrentTable property when attaching the overlay to a scenario instance table. Attaching to a scenario instance table requires less memory but the resulting overlay may be missing one or more data points. This can occur if the dashboard is running on a heavily loaded system. Unless you have severe memory restrictions, you should not attach overlays to a scenario instance table. Better results can be achieved by attaching to a scenario trend table. This will guarantee that the overlay contains all data points.
Copyright © 2013
Software AG, Darmstadt, Germany and/or Software AG USA Inc., Reston, VA, USA, and/or Terracotta Inc., San Francisco, CA, USA, and/or Software AG (Canada) Inc., Cambridge, Ontario, Canada, and/or, Software AG (UK) Ltd., Derby, United Kingdom, and/or Software A.G. (Israel) Ltd., Or-Yehuda, Israel and/or their licensors.