Using Object Grids
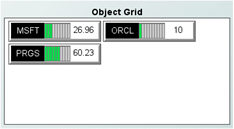
The Object Grid allows you to display tabular data using one or more other object types to show the values of DataView fields. An Object Grid is, as the name implies, a grid of objects. Following is an example of an object grid from the Object Grid tutorial sample:
Here the grid is using one of the label object types in order to display the Instrument and Price variables of the tutorial DataView instances. The label object used provides a graphical indication of the price as well. There is one instance of the label object for DataView field. If a new instance is created, an entry for it would automatically be added to the object grid.
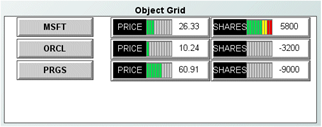
Most objects that appear in the object palette can be displayed in the object grid. Exceptions include tables, some graphs and some general objects. More than one object can be used to visualize each row in the tabular data.
The grid above uses three objects to display the Instrument, Price, and Shares variables of the DataView items.
Object grids provide one alternative to table objects for visualizing tabular data. They are simple to use but provide limited control over the layout of the objects:

Objects within a grid are each given the same space as the largest object in the grid.

Objects within a grid are positioned using a flow layout; positioning objects in the top-left corner of the grid and progressing to the right and bottom.
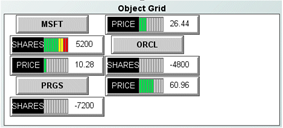
The following illustrates the layout behavior of the object grid:
This is the same object grid as in the previous illustration. The only change is that it was resized to be slightly narrower which caused the flow layout of objects to change.
If precise control over the layout of objects is required use the Composite or Composite Grid objects.


