There are three kinds of trace processing that can occur when using Kernels:
Traces can be performed for individual Kernel processing.
Traces can be performed for Software AG transport services processing (XTSTRACE).
Traces can be performed for Software AG communications processing (ADALNK).
Tracing should be used only for problem analysis. When you specify trace levels, large trace files will be stored on your disks and performance will be affected. Therefore, we recommend that you perform this function only under the advisement of your Software AG technical support representative.
This document covers the following topics:
Tracing should be used only for problem analysis. When you specify trace levels, large trace files will be stored on your disks and performance will be affected.
| Warning: While you can set the trace level for a Kernel using SMH, we recommend that you perform this function only under the advisement of your Software AG support representative. |
You can set the trace level for a Kernel dynamically (immediately and for only this execution of the Kernel) or permanently (for future executions of the Kernel). The dynamic trace level setting occurs immediately, but if the Kernel is restarted, it is reset to the trace level specified in the Kernel definition. The permanent trace level setting occurs in the Kernel definition and takes effect only when the Kernel is restarted.
This section covers the following topics:
 To set the trace level offline in SMH for the Kernel:
Make sure you have accessed the System Management Hub.
Select the name of the managed host on which Entire Net-Work Server is installed.
Expand the tree-view frame for the managed host by clicking on the plus sign (+) to the left of its name.
Select "Entire Net-Work Server" in the tree-view under the managed host.
The Entire Net-Work Server administration area of the System Management Hub becomes available to you.
Expand Servers in tree-view, by clicking on the plus sign (+) to the left of its label.
The list of installed servers appears.
Expand the name of the server in the server list in tree-view, by clicking on the plus sign (+) to the left of its label.
A list of Kernels defined to the server appears.
In tree-view, right-click on the name of the Kernel for which you want to set the trace level and select command from the resulting drop-down menu.
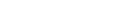
The Set Kernel Trace Granularity panel appears in detail-view.
Select appropriate trace levels as requested by your Software AG support representative.
The Trace All, No Trace, and Ignore global settings radio buttons are mutually exclusive selections. The Trace All and No Trace radio buttons are provided as global trace settings.
If you select Trace All, data is collected for all of the trace levels listed on the panel, regardless of what you have selected (checked).
If you select the No Trace radio button, data is collected for none of the trace levels listed on the panel, regardless of what you have selected (checked).
The Ignore global settings radio button must be selected if you want to collect trace data for only some of the trace levels listed on the panel. This ensures that neither the Trace All and No Trace radio buttons are selected and indicates to Entire Net-Work that specific trace level data collection is requested.
Click .
The trace level is set. You must restart the Kernel in order for these trace level changes to take effect.
To set the trace level offline in SMH for the Kernel:
Make sure you have accessed the System Management Hub.
Select the name of the managed host on which Entire Net-Work Server is installed.
Expand the tree-view frame for the managed host by clicking on the plus sign (+) to the left of its name.
Select "Entire Net-Work Server" in the tree-view under the managed host.
The Entire Net-Work Server administration area of the System Management Hub becomes available to you.
Expand Kernels in tree-view, by clicking on the plus sign (+) to the left of its label.
The list of Kernels that have been started appears.
In tree-view, right-click on the name of the Kernel for which you want to set the trace level and select command from the resulting drop-down menu.
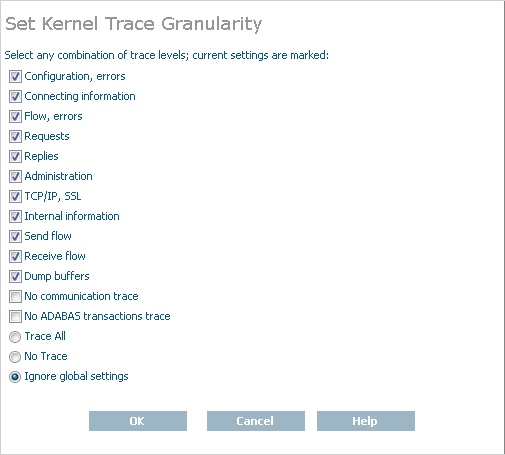
The Set Trace Level Online panel appears in detail-view.
Select appropriate trace levels as requested by your Software AG support representative.
The Trace All, No Trace, and Ignore global settings radio buttons are mutually exclusive selections. The Trace All and No Trace radio buttons are provided as global trace settings.
If you select Trace All, data is collected for all of the trace levels listed on the panel, regardless of what you have selected (checked).
If you select the No Trace radio button, data is collected for none of the trace levels listed on the panel, regardless of what you have selected (checked).
The Ignore global settings radio button must be selected if you want to collect trace data for only some of the trace levels listed on the panel. This ensures that neither the Trace All and No Trace radio buttons are selected and indicates to Entire Net-Work that specific trace level data collection is requested.
Click .
The trace level is temporarily set. Once the Kernel is restarted, it will revert to using its original trace settings.
Tracing should be used only for problem analysis. When you specify trace levels, large trace files will be stored on your disks and performance will be affected.
| Warning: We recommend that you perform this function only under the advisement of your Software AG support representative. |
Once Software AG transport services tracing is activated, the trace messages are written to the Entire Net-Work Client log file. For more information about the Entire Net-Work Client log file, read Managing Kernel Log Files.
To set the Software AG transport services trace level and activate
transport services tracing:
Make sure you have accessed the System Management Hub.
Select the name of the managed host on which Entire Net-Work Server is installed.
Expand the tree-view frame for the managed host by clicking on the plus sign (+) to the left of its name.
Select "Entire Net-Work Server" in the tree-view under the managed host.
The Entire Net-Work Server administration area of the System Management Hub becomes available to you.
Expand Servers in tree-view, by clicking on the plus sign (+) to the left of its label.
The list of installed servers appears.
Expand the name of the server in the server list in tree-view, by clicking on the plus sign (+) to the left of its label.
A list of Kernels defined to the server appears.
In tree-view, right-click on the name of the Kernel for which you want to set the trace level and select command from the resulting drop-down menu.
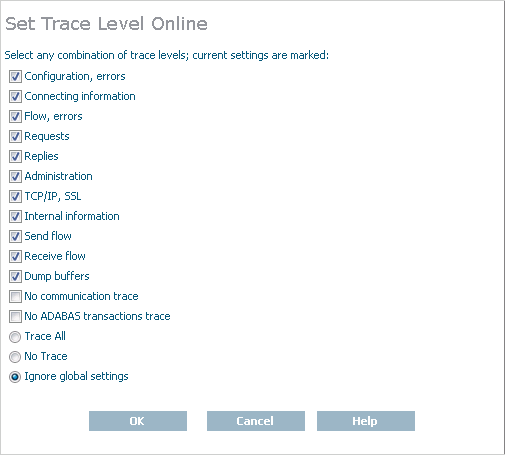
The Kernel Basic Parameters panel appears in detail-view.
Modify the XTSTRACE parameter and Full XTS Trace checkbox on the Kernel Basic Parameters panel, as requested by your Software AG technical support representative. These parameters are described in the following table. When all parameters are set as you want, click to save them.
| Parameter | Description |
|---|---|
| XTSTRACE | Set the XTS trace level using this parameter. |
| Full XTS Trace | Click in this checkbox to set the XTSTRACE value to obtain full tracing of Software AG transport services processing. Do not check this checkbox unless specifically instructed to do so by a Software AG Customer Support representative. If you do, your installation could be overrun with trace messages that would be meaningless to you and would likely affect system performance. |
The transport services trace levels are set and activated.
Tracing should be used only for problem analysis. When you specify trace levels, large trace files will be stored on your disks and performance will be affected.
| Warning: We recommend that you perform this function only under the advisement of your Software AG support representative. |
Once Software AG communications tracing is activated, the trace messages are written to the Entire Net-Work Client log file. For more information about the Entire Net-Work Client log file, read Managing Kernel Log Files.
To set the Software AG communications trace level and activate
communications tracing:
Make sure you have accessed the System Management Hub.
Select the name of the managed host on which Entire Net-Work Server is installed.
Expand the tree-view frame for the managed host by clicking on the plus sign (+) to the left of its name.
Select "Entire Net-Work Server" in the tree-view under the managed host.
The Entire Net-Work Server administration area of the System Management Hub becomes available to you.
Expand Servers in tree-view, by clicking on the plus sign (+) to the left of its label.
The list of installed servers appears.
Expand the name of the server in the server list in tree-view, by clicking on the plus sign (+) to the left of its label.
A list of Kernels defined to the server appears.
In tree-view, right-click on the name of the Kernel for which you want to set the trace level and select command from the resulting drop-down menu.
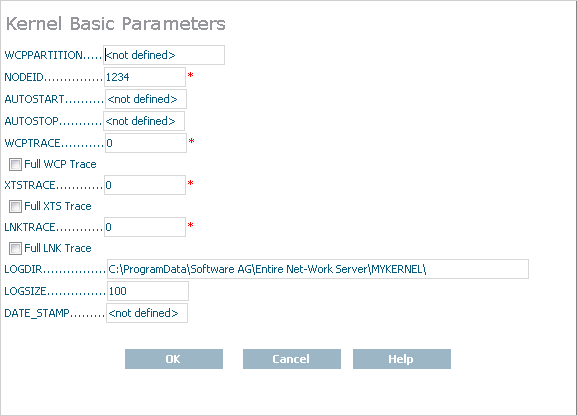
The Kernel Basic Parameters panel appears in detail-view.
Modify the LNKTRACE parameter and Full LNK Trace checkbox on the Kernel Basic Parameters panel, as requested by your Software AG technical support representative. These parameters are described in the following table. When all parameters are set as you want, click to save them.
| Parameter | Description |
|---|---|
| LNKTRACE | Set the ADALNK trace level using this parameter. |
| Full LNK Trace | Click in this checkbox to set the LNKTRACE value to obtain full tracing of ADALNK processing. Do not check this checkbox unless specifically instructed to do so by a Software AG Customer Support representative. If you do, your installation could be overrun with trace messages that would be meaningless to you and would likely affect system performance. |
The communications trace levels are set and activated.