
The Server Status tab shows a system-wide server view.
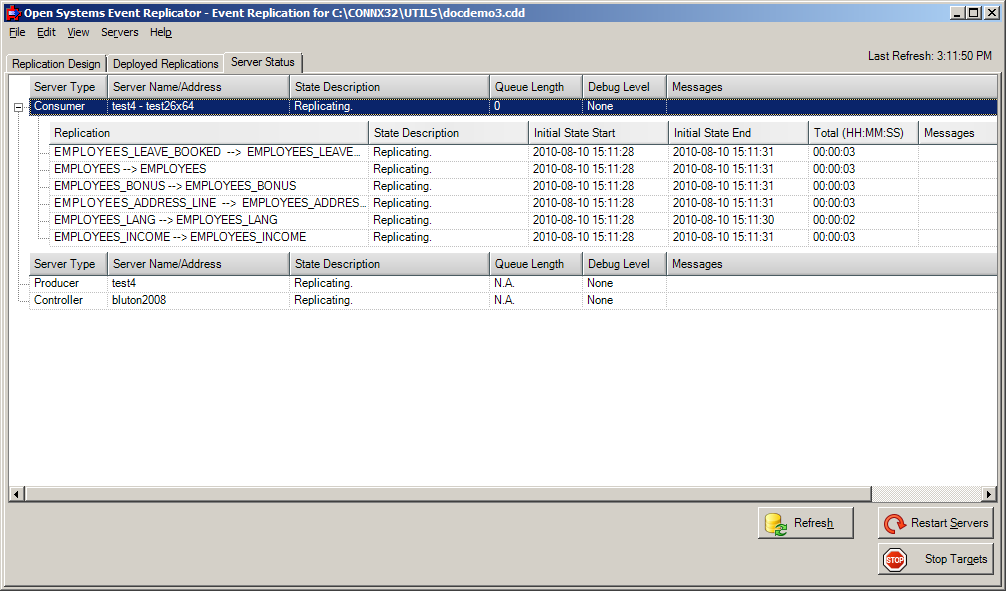
This grid contains the status for all the Replication components. The columns and their meaning are as follows:
Server Type
Controller
The Controller is responsible for accepting work messages from
the Administrator and distributing those work orders to the Event
Producer and Event Consumer. The Controller manages error messages
as well as work messages and is responsible for starting and stopping
the Event Consumer. It resides on the same system as the Event
Consumer but does not need to be on the same system as the Event Producer
or the target database.
Producer
The Event Producer resides on the same system as Adabas and
is loaded into the process space of the Adabas nucleus. When
changes are made in Adabas files that have been identified for replication,
the Event Producer stores those changes in a persistent store on the
hard drive. When it receives an ET for a transaction, the Event
Producer assembles all the elements of the transaction into a message
and puts it on the message queue.
Consumer
The Event Consumer is responsible for taking transactions off
the message queue and executing them on the target database. Once
a transaction has been successfully committed, it will be removed
from the message queue. There is one Event Consumer for each
source DBID/target database pair. If two Adabas DBID's are being
replicated to a single target database, there will be two Event Consumers;
one for each source/target combination. In addition to transaction
processing, the Event Consumer is also responsible for Initial State
processing. The number of initial states or transactions it
can process in parallel is determined by the Parallel transaction
count setting on the Config Servers dialog. This dialog can
be access from the Servers menu on the Replication Design Tab. Under
each Consumer entry on the grid is a list of replications currently
being processed for that Event Consumer. Each replication entry
has the following columns:
Replication: This is the name of the source table followed by the name of the target table.
State Description: This tells the current state of the replication. For a complete list of State Descriptions, see below.
Initial State Start: This is the date and time the last initial state was started for this replication.
Initial State End: This is the date and time the last initial state ended.
Total (HH:MM:SS): The total time the last initial state took for this replication.
Messages: If there are any error
messages associated with this replication, they will be displayed
here. Hint: Double
click on this field to display the entire message in an edit box
for easier reading.
The Event Consumer can show performance statistics about the replications if the controller has the CTRL_PERF_ENABLED registry setting set to 1. The amount of time each statistics period is collected before it is recorded is 30 seconds by default or can be set with the CTRL_PERF_QUERY_INTERVAL registry setting. Once the controller is recording and sending back statistics, they can be hidden on the Replication Administrator for clarity by unchecking View --> Show Statistics. The statistics recorded are:
Consumer start date - the day and time the consumer first started replicating after a deploy.
Status Interval length - the length of time in seconds statistics are gathered before recording them. (set in the registry on the controller).
Statistics Totals
Consumer Since Start - these are the total values collected since the engine was started with the first deploy.
Last Interval - these are the total values collected during the last statistics recording interval (as set by the CTRL_PERF_QUERY_INTERVAL registry setting).
Statistics Rates
Consumer Total - these are the rates for this consumer. Rates are determined amount per second.
Record Loader(i) - these are the rates for each Record loader the consumer is running. The number of Record loaders is set in the Replication administrator Config Servers screen with the "Parallel transaction count".
Initial States - the number of initial states processed by this consumer.
Transactions - number of transactions the consumer has processed and committed to the target.
Rows Processed - number of individual rows processed by the consumer and sent to the target.
Events - number of messages from the source processed and sent to the target by the consumer.
Inserts - number of rows inserted into the target by the consumer.
Updates - number of rows updated in the target by the consumer.
Deletes - number of rows delete in the target by the consumer.
Errors - number of errors recorded during replication by the consumer.
Server Name/Address
This is the name of the server that the corresponding component
is installed on.
State Description
This tells the current state of the component or replication.
Potential values and their meaning are as follows:
Replicating: Active and replicating.
Not Replicating - offline: This indicates that either the target database as gone down or replication has been stopped by pressing the Stop Targets button. (see below) This is a Consumer status message.
Replication Offline: This indicates that an individual replication is offline either due to an unrecoverable error on the target or by pressing the Stop Targets button. (see below) This is a Replication status message.
Processing Initial State...: On the Consumer, this indicates that it is processing initial states. Each replication that is actively being processed will also indicate this status.
Initial State Pending: This indicates that an initial state has been requested for a replication, but it has not started yet.
Initial State Complete: This indicates that an initial state has finished for this replication but the overall process has not yet been completed by the Event Consumer. Once all pending initial states have completed, the consumer and all replications with a successful initial state will go to a Replicating status.
Initial State Failed: This indicates that an error occurred during initial state processing. Check the Messages field for more information about the error.
Deploy Failed: This indicates that an error occurred during the deploy process. Check the Messages field for all components for mor information about the error.
No Active Configuration: This indicates that nothing has been deployed to the controller.
Status of the System Unknown/Unable to contact controller: This indicates that the Replication Administrator was not able to contact the controller to get status. Common causes of this message are the controller is not running or the message queues on either the Administrator machine, the EP machine or the controller machine are not running.
Queue Length
This indicates the number of elements in the queue. In
normal operation, this number will grow and shrink depending on
load. A rapid increase in this number that never goes down
is an indication that the target database is offline and transactions
are queuing but not being processed on the target.
Debug Level
This indicates the debug level of each component. There
are 3 possible values:
None: Minimal messages are written to the log. Errors are always written.
Verbose: Diagnostic information is written when errors occur along with transaction information.
Extreme: Complete
diagnostics including buffer and transaction dumps are written
to the log. Note:
This mode will cause a degradation in performance. Only
use this mode when debugging an error situation.
Messages
If there are any error messages associated with this
component, they will be displayed here. Hint:
Double click on this field to display the entire message
in an edit box for easier reading.
The server status information will automatically refresh every 30 seconds. To manually refresh the server status, click the Refresh button.
The Time field in the upper right corner will contain the latest refresh time.
You can also adjust the display column width.