This section describes the statistics available in SOA Gateway.
The existing functionality helps determine the level of work flow activity through a server system. The infrastructure is also in place to enable other forms of statistics gathering such as performance monitoring, number of users and so on.
Work flow monitoring is set off by default. When on it will provide Key Performance Indicators (KPIs) on well know operations list, get, add, delete, update, invoke, select, selectCount, selectNext and selectEnd.
KPIs can be gathered at the server level, web service level or at the driver level.
The KPIs gathered for each operation are as follows:
total_count
This is the number of times the operation has been called. If successful then the round trip time is added to total_time. If applicable high_time or low_time may be updated. If the operation is unsuccessful then errors_occurred is incremented.
total_time
This is the accumulated round trip time for the operation.
high_time
This is the highest round trip time for the operation.
low_time
This is the lowest round trip time for the operation.
errors_occurred
This is the number of times the operation has failed.
Setup is carried out using the SOA Gateway Control Centre.
Click on the server to be monitored in the list of SOA Gateway Servers. Then click on the Statistics tab within the Properties View as shown below:
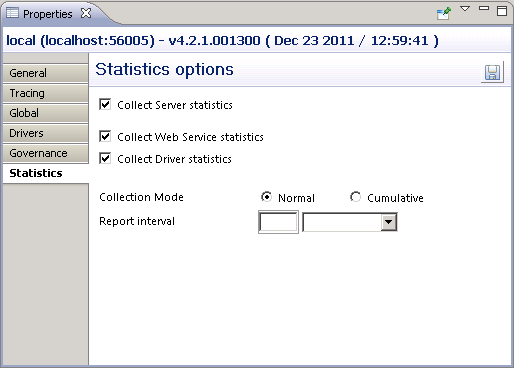
Collect Server statistics must be set on to enable any level of monitoring. This produces data at the server level.
Collect Service statistics enables gathering at the web service level for all services.
Collect Driver statistics enables gathering at the driver level.
Statistics can be collected in 2 modes, Normal and Cumulative. An interval can be set to control when a report is written.
Statistics are gathered from the point at which they are set on up to when the server is stopped or when they are set off or when the mode is changed to Cumulative or when the report interval has been reached. A file is written with the KPIs at that point. The name of the file has the format soag_normal_statistics_yyyy_mm_dd_hh_mm_ss_millisec.xml e.g.
soag_normal_statistics_2008_10_09_12_56_11_364.xml
Statistics gathering continues over server stop/starts. When the server is stopped the data is written to the file soag_cumulative_statistics.xml. On restart the same file is read and used to initialise the statistics.
The default behaviour is for a report to be written when the server is stopped. Setting an interval enables reporting at set periods.
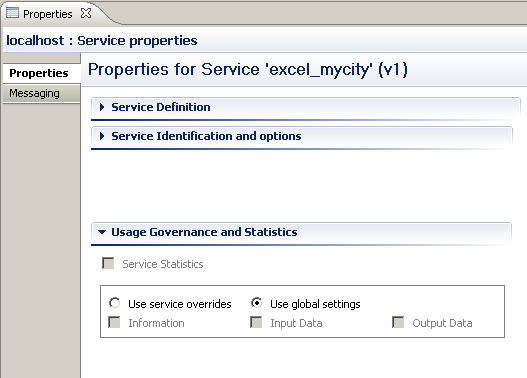
Click on the service to be monitored. In the Properties View set Service Statistics on/off. Note that the global setting overrides this setting and it will be greyed out if set on at the global level as shown below.
If you wish to monitor for a particular service set the global setting off and turn on at the service level.
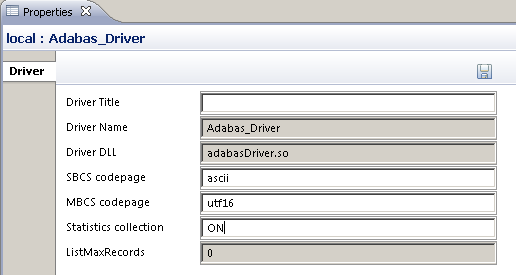
Click on the driver to be monitored. In the Properties View set Statistics collection to ON/OFF.
Statistics monitoring can be carried out on an ad hoc basis, again using the SOA Gateway Control Centre.
Open/click on the SOA Gateway Statistics view. If this view if not visible open menu items Window --> Show View --> Other... and select SOA Gateway Statistics under the SOA Gateway Administration folder.
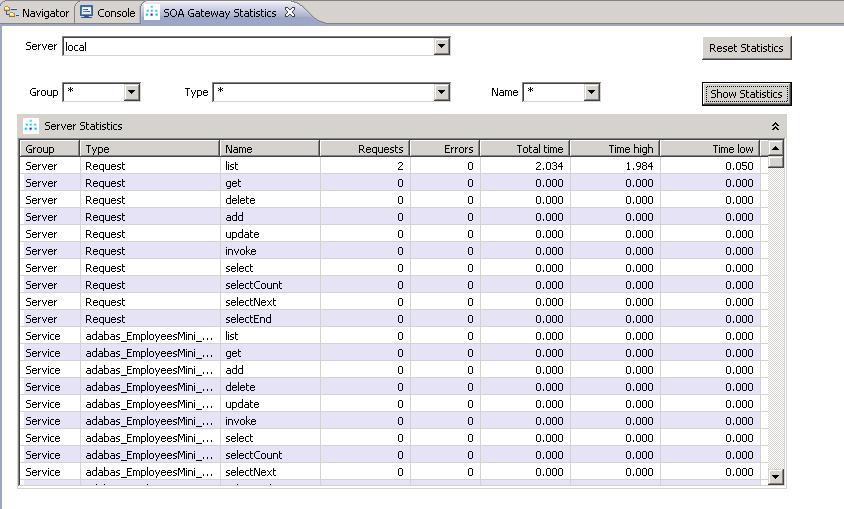
Pick the server from the Server listbox. Group, Type and Name can be wildcarded i.e. set to * or set to a particular value e.g. Adabas_Driver
Note that the wildcarding is asterisk only i.e. Adabas* is not acceptable.
Then click on the Show Statistics button to refresh the data.
The statistics can be reset at any time by selecting the Reset Statistics button.
The format of the normal and cumulative report is identical. Here is an extract from a normal file:
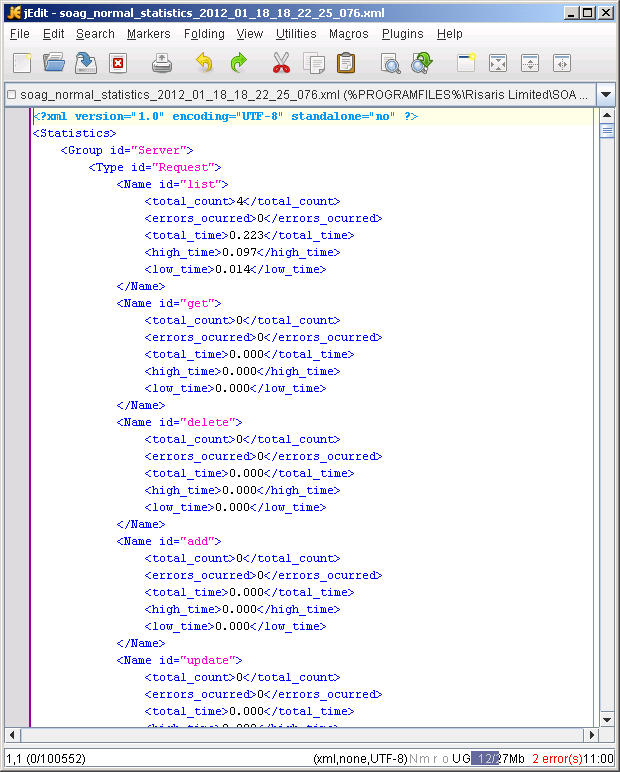
The statistic reports are written to the configuration folder where SOA Gateway is installed.
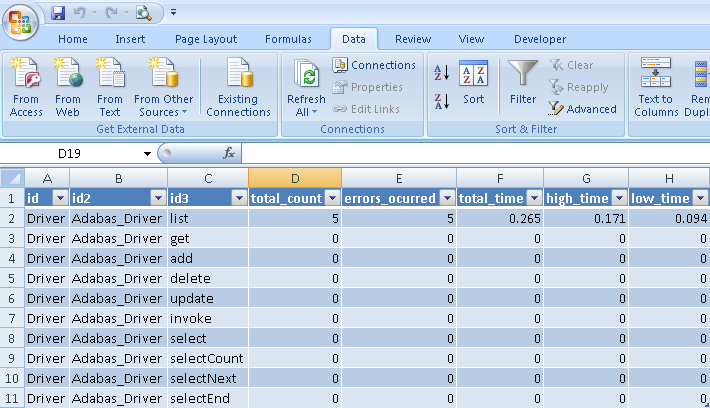
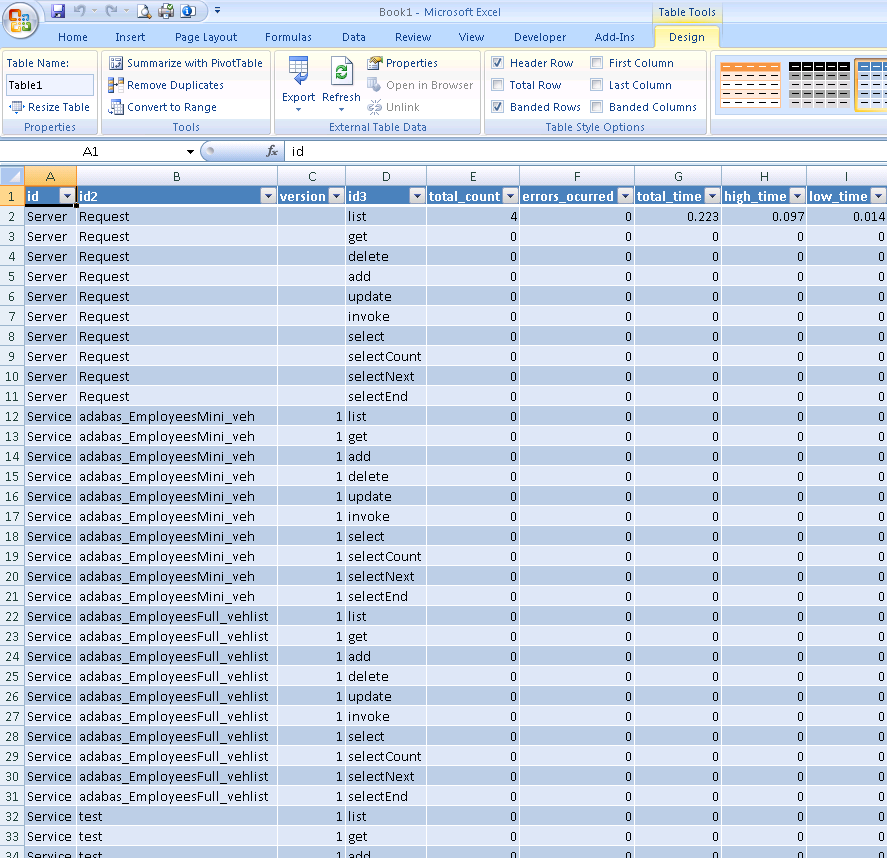
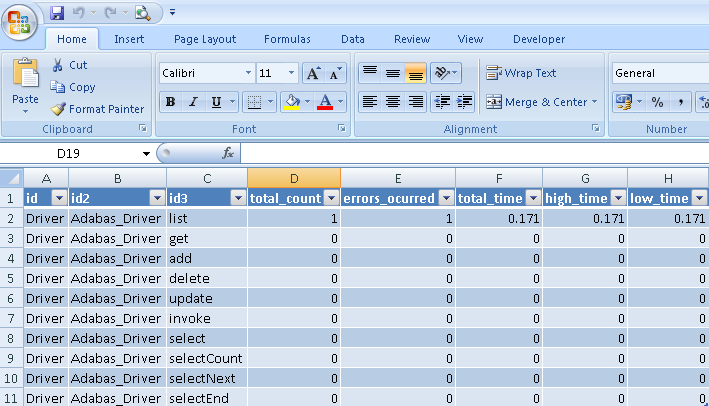
As the statistics report is an XML file there are many programs which can consume this format e.g. In Excel you can import the XML file from
the SOA Gateway configuration directory :
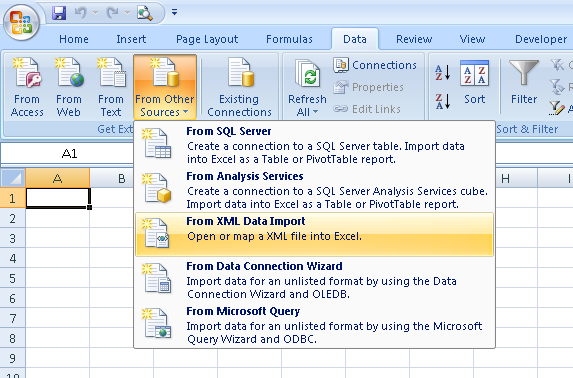
resulting in a very readable format::
Access to statistics is also made available via the statService web service as described by the WSDL http://server:port/statService?WSDL.
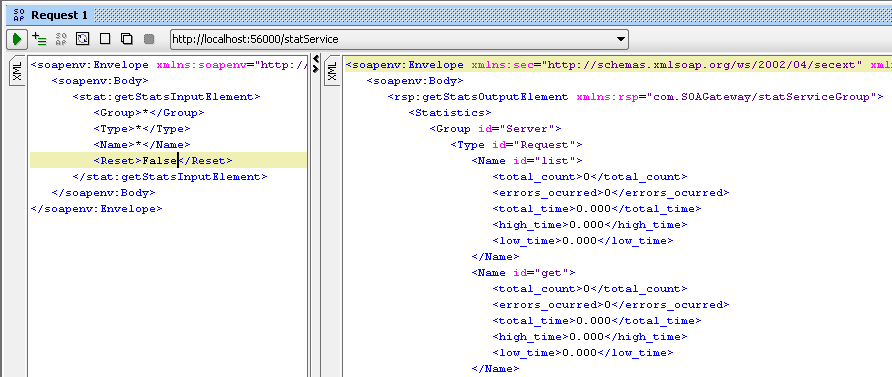
Statistics can be retrieved via a SOAP request using the statService web service. Using a WSDL consumer such as soapUI, as shown below, a request can be made using Group, Type and Name. As with the Control Centre, the ‘*’ construct enables the entire set of statistics to be returned or a subset. The Reset option can be set to True or False as required. The default value is False if omitted.
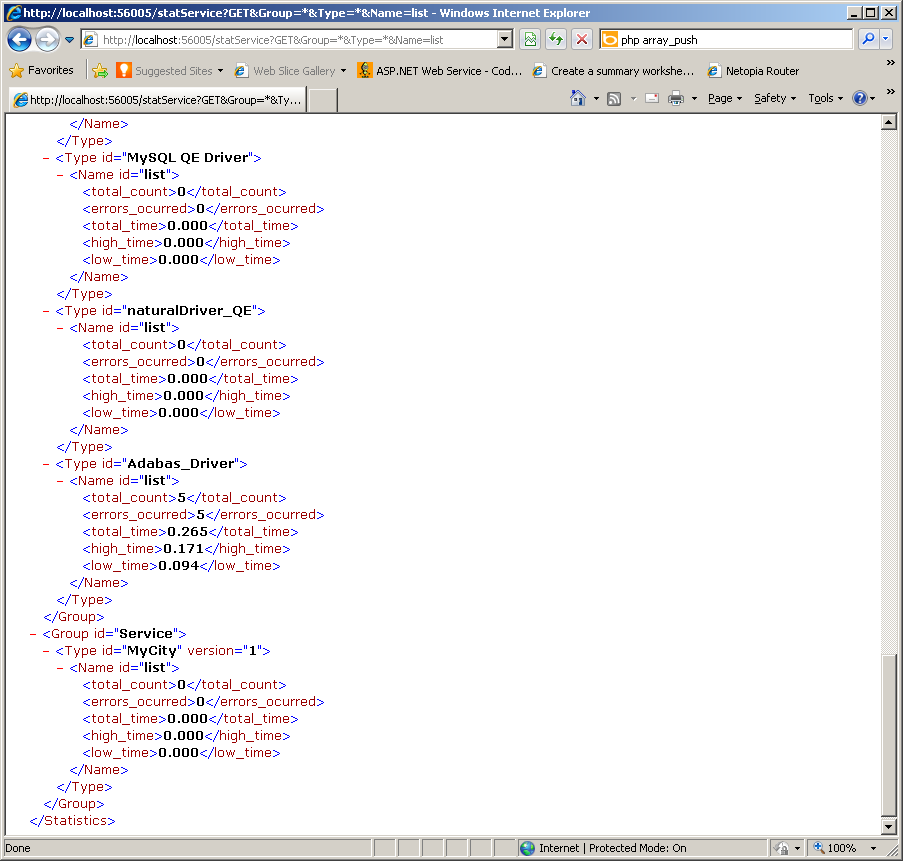
The statistics can also be retrieved via a URL-based request in a browser such as Internet Explorer. The statService service exposes one method, GET. As with previous requests this can be restricted by Group, Type and Name. Again the ‘*’ construct enables the entire set of statistics to be returned or a subset by specifying a value. The option is also provided to reset the current set of statistics. The example below restricts the search to the list method.
http://localhost:56005/statService?GET&Group=*&Type=*&Name=list
Let us assume that the server has been started for the first time and that statistics collection has been set on for the first time. An Adabas database is available and a web service created to access it. Both queries below are issued via a browser such as IE. The LIST successfully retrieves the data for employees whose ids start with 200. The GET query fails because the syntax is incorrect.
http://localhost:56005/Adabas_Driver_1_9?GET=20020000
http://localhost:56005/Adabas_Driver_1_9?LIST&AA=200*
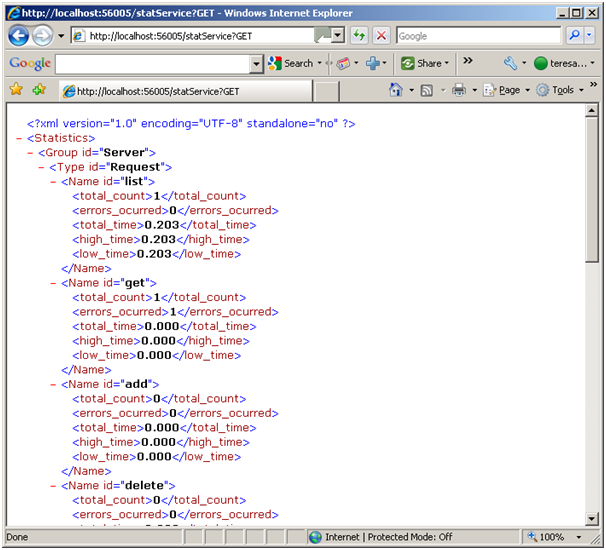
Now get the statistics so far by issuing a GET on statService as shown below. Note that the entry for the get request does not show any effect on the times. Note that for list, for the moment, all times are identical. The time is 0.203 or 203 milliseconds. This is the round trip time spent in the SOA Gateway Server.
Let us issue the LIST and GET again, this time correcting the GET syntax and changing the LIST to retrieve ids starting with 20:
http://localhost:56005/Adabas_Driver_1_9?GET&AA=20020000
http://localhost:56005/Adabas_Driver_1_9?LIST&&AA=20*
Note the now successful entry for the get operation. Note also that for list the high time is now 0.234 as the query took slightly longer. As there have been only 2 list requests so far the total time equals the sum of low and high times.

The ability to use a URL request also enables us to use Excel to query the latest statistics. Open Excel and navigate to Data -> From Web. Enter the required request as shown below and select Go. The result should be returned as shown:
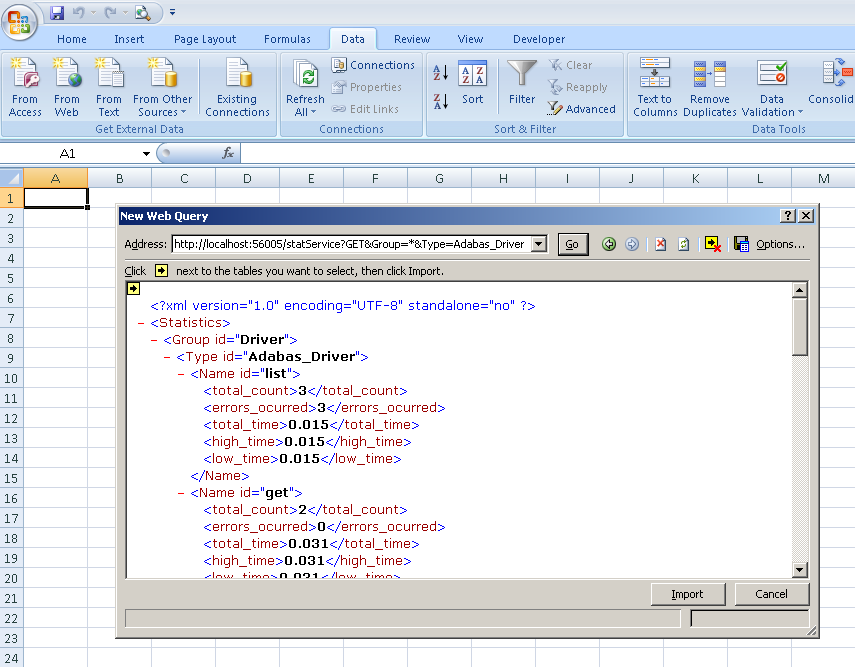
Select Import and accept the default location of A1.
The imported result can be refreshed to display changes in the statistic being queried. Select Data -> Refresh All.