
This document covers the following topics:
The content and the format of the Evaluation Reports generated by ASF depend on the Evaluation Type specified by the DBA. The valid Evaluation Types are predefined in ASF.
There are 10 Evaluation Types. Types 1-8 are used for evaluating past and current database usage, and are not concerned with critical values. Types 9 and 10 are used for critical value reports.
Some of the Evaluation Reports allow statistical operations to be performed on the reported values, for example sum, average, minimum, maximum. This is called external accumulation. Other reports print values which are already the result of one of the statistical functions. This is called internal accumulation.
Note:
ASF does not perform extensive plausibility checking when the
statistical operations are selected. It is, for example, possible to request
the sum of all values of the LBP (length of buffer pool) parameter over a given
time frame, even though the resulting value is meaningless.
Each Evaluation Type is associated with a particular combination of databases, files, data fields and dates and times.
Evaluation Types 1-4 refer to database-related data fields (properties of a whole database), whereas Evaluation Types 5-8 refer to file-related data fields (properties of individual files within a database). Thus the text "(DB)" in the following description of Evaluation Type 1-4 indicates that the report shows database-related data fields only, whereas the text "(FI)" of Evaluation Type 5-8 indicates that the report shows file-related data fields only.
| Type | Title | Horizontal Axis | Vertical Axis | Third Axis |
|---|---|---|---|---|
| 1 | One DB at point in time (DB) | Times | Fields | DBs |
| 2 | DBs in time frame (DB) | DBs | Fields | (cumulated within a time frame) |
| 3 | DBs at point in time (DB) | DBs | Fields | Times |
| 4 | One field at point in time (DB) | DBs | Times | Fields |
| 5 | One DB at point in time (FI) | Times | Fields | Files |
| 6 | DBs in time frame (FI) | Files | Fields | (cumulated within a time frame) |
| 7 | DBs at point in time (FI) | Files | Fields | Times |
| 8 | One field at point in time (FI) | Files | Times | Fields |
| 9 | Critical report: List of fields, databases and files | DBs, files, fields, the value reached and the defined limit value. | ||
| 10 | Critical trend: List of fields, databases and files | DBs, files and fields, the limit value and the date when the limit will be reached. | ||
Figure 2-1: Overview of the Evaluation Types
General evaluations (type 1 to 8) can display real as well as trend values. A critical report (type 9) displays real values only. A critical trend extrapolates real values into future trends and analysis both.
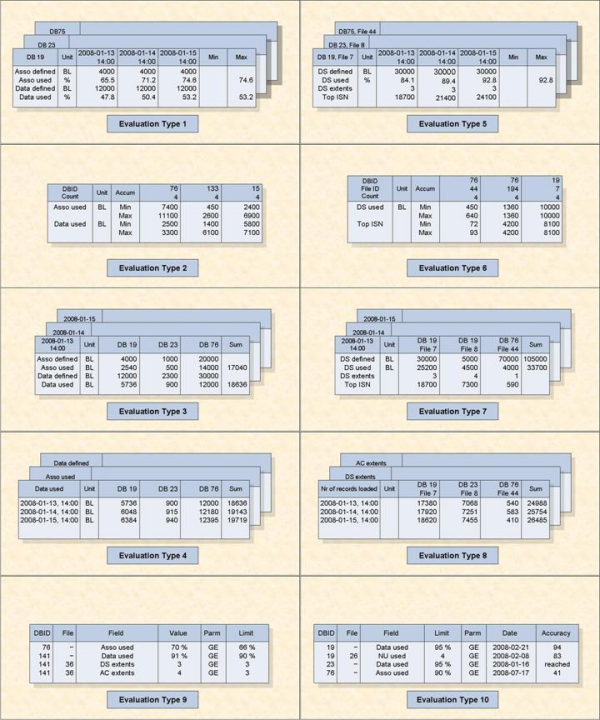
Figure 2-2: Evaluation Type Report Format
In the following summary of the ten Evaluation Types, a short text describing the output format of the corresponding report is included. This is the same text which appears automatically on the screen when the evaluation type is selected in an online screen.
This section covers the following topics:
Evaluation Type 1: One DB at point in time (DB) V:Fields H:Times (external accumulation)
Evaluation Type 2: DBases in time frame(DB) V:Fields H:Databases (internal accumulation)
Evaluation Type 3: DBases at point in time (DB) V:Fields H:Databases (external accumulation)
Evaluation Type 4: One field at point in time (DB) V:Times H:Databases (external accumulation)
Evaluation Type 5: One DB at point in time (FI) V:Fields H:Times (external accumulation)
Evaluation Type 6: DBases in time frame (FI) V:Fields H:Databases (internal accumulation)
Evaluation Type 7: DBases at point in time (FI) V:Fields H:Databases (external accumulation)
Evaluation Type 8: One field at point in time (FI) V:Times H:Databases (external accumulation)
Evaluation Type 9: Critical report: List of fields, databases and files
Evaluation Type 10: Critical trend: List of fields, databases and files
Purpose: Gives an overview of the growth of a particular database.
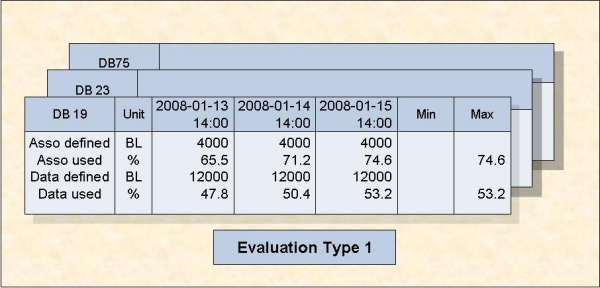
Figure 2-3: A database at various times (Type 1)
Various database-related data fields for a single database are displayed as recorded at a list of points in time. This evaluation shows data fields on the vertical axis and times on the horizontal axis. An external accumulation is also possible. The table of results is three-dimensional. The third axis is a list of databases.
Purpose: Gives an overview of several databases (accumulated values only) within a time frame.
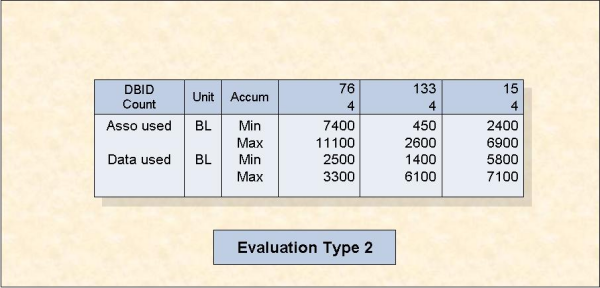
Figure 2-4: Several databases accumulated within a time frame (Type 2)
This evaluation shows the cumulative values (internal accumulation) of various database-related data fields as recorded in several databases within a time frame. The vertical axis is a list of data fields, each qualified by the statistical quantity being represented, e.g. MAX, MIN, AVERAGE, and the units of measurement, e.g. disk space measurements (Blocks / Cylinders / Megabytes) or frequency measurements, expressed as occurrences per minute (which is abbreviated to "PM"). The horizontal axis is the list of databases. The table of results is two-dimensional.
Purpose: Gives an overview of several databases at a point in time.
Figure 2-5: Several databases at one point in time (Type 3)
This evaluation lists the values of various database-related data fields as recorded in several databases at a single point in time. The vertical axis is a set of database-related data fields, wherever necessary qualified by a unit of measurement. The horizontal axis is a list of databases. An external accumulation is possible. The table of results is three-dimensional. The third axis is a list of points in time.
Purpose: Shows how a data field in several databases behaves within a time frame.
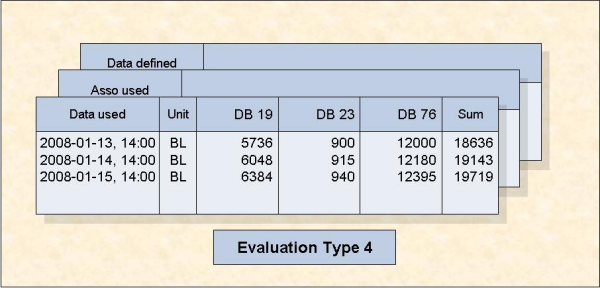
Figure 2-6: One field in various databases at various times (Type 4)
This evaluation refers to a single database-related data field as measured in several databases at various points in time within a time frame. The vertical axis is a list of points in time, i.e. the times at which a measurement was made. The horizontal axis is a list of files. An external accumulation is also possible. The table of results is three-dimensional. The third axis is a list of database-related data fields.
Purpose: Gives an overview of the growth of a particular file.
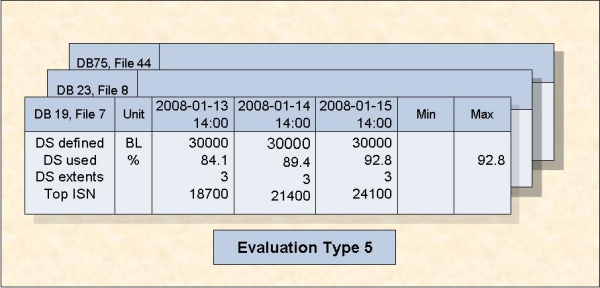
Figure 2-7: A file at various times (Type 5)
Various file-related data fields for a single file are displayed as recorded at a list of points in time. This evaluation shows data fields on the vertical axis and times on the horizontal axis. An external accumulation is possible. The table of results is three-dimensional. The third axis is a list of files.
Purpose: Gives an overview of several files (accumulated values only) within a time frame.
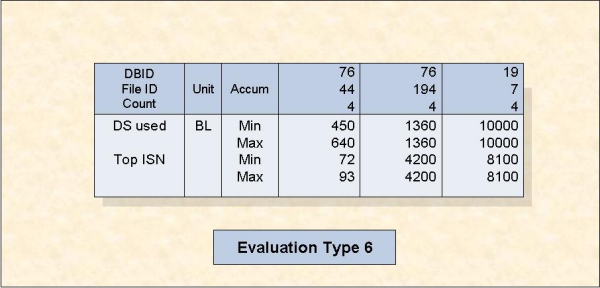
Figure 2-8: Several files accumulated within a time frame (Type 6)
This evaluation shows the cumulative values (internal accumulation) of various file-related data fields as recorded in several files during a time frame. The vertical axis is a list of data fields, each qualified by the statistical quantity being represented, e.g. MAX, MIN, AVERAGE, and the units of measurement, e.g. disk space measurements (Blocks/ Cylinders/ Megabytes) or frequency measurements, expressed as occurrences per minute (which is abbreviated to "PM"). The horizontal axis is the list of files. The table of results is two-dimensional.
Purpose: Gives an overview of several files at a point in time.
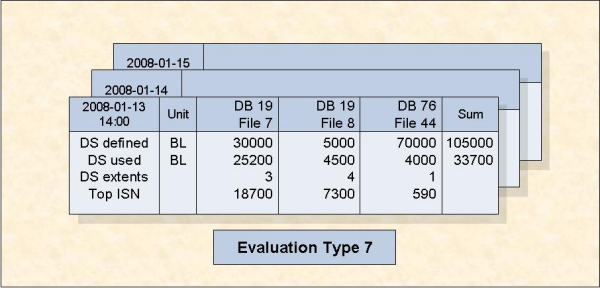
Figure 2-9: Several files at one point in time (Type 7)
This evaluation lists the values of various file-related data fields as recorded in several files at a single point in time. The vertical axis is a set of file-related data fields, wherever necessary qualified by a unit of measurement. The horizontal axis is a list of files. An external accumulation is possible. The table of results is three-dimensional. The third axis is a list of points in time.
Purpose: Shows how a data field in several files behaves within a time frame.
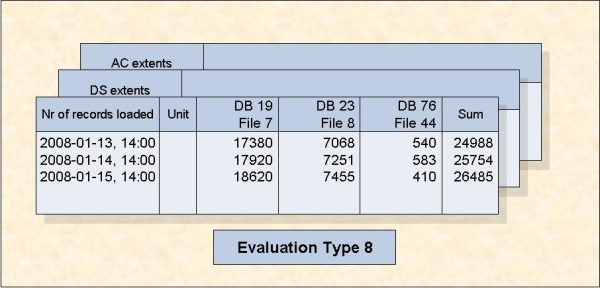
Figure 2-10: One field in various files at various times (Type 8)
This evaluation refers to a single file-related data field as measured in several files at various points in time within a time frame. The vertical axis is a list of points in time, i.e. the times at which a measurement was made. The horizontal axis is a list of files. An external accumulation is also possible. The table of results is three-dimensional. The third axis is a list of file-related data fields.
Purpose: Shows the current critical fields.
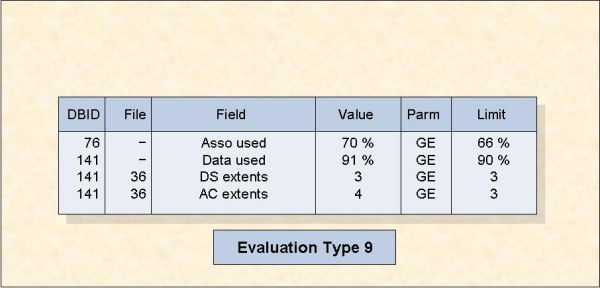
Figure 2-11: Critical Report (Type 9)
This evaluation shows a list of data fields whose current values have reached or exceeded the critical values defined by the DBA for those fields.
The table of results is two-dimensional.
Purpose: Predicts fields which will become critical within a given time frame.
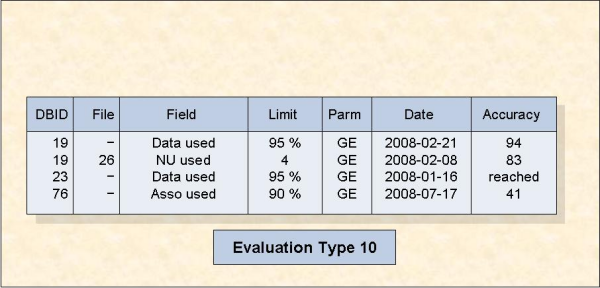
Figure 2-12: Critical Trend Report (Type 10)
This evaluation shows a list of data fields which will reach or exceed their critical values at some time in the near future if current trends continue. The predictions are based on a straight-line approximation of past and current values.
The table of results is two-dimensional.
The reports for evaluation types 1-8 are either two-dimensional or three-dimensional tables of values. Figure 2-13 is an example of the layout generated when you use Evaluation Type 1, which produces a three-dimensional table of values. This Evaluation Type displays ASF fields on the vertical axis, and dates and times on the horizontal axis. The third axis is the list of databases specified in the Evaluation Profile for this report; the example shows data for the database "DB016-ALSBACH", whose DBID is 16. (The output was generated by running Predefined Evaluation 6 - see the section on predefined evaluations for details).
15:23:57        *** A D A B A S  Statistics Facility ***            2008-02-22
USERID        DBID:   16    DB-NAME:   DB016-ALSBACH   1/1          MEV15001

 STORE-DATE       ! UNIT!  1992-03-09 !  1992-03-16 !  1992-03-23 !  1992-03-30
 STORE-TIME       !     !       17:34 !       23:00 !       23:00 !       22:00
 -----------------+-----+-------------+-------------+-------------+------------
 DB-NAME          !     ! DB016-ALSBA ! DB016-ALSBA ! DB016-ALSBA ! DB016-ALSBA
 DATE NUC-START   !     !  1992-03-09 !  1992-03-16 !  1992-03-23 !  1992-03-30
 TIME NUC-START   !     !       02:32 !       02:41 !       02:43 !       02:38
 ASSO DEFINED     ! CYL !         530 !         530 !         530 !         530
 ASSO USED        ! CYL !         268 !         227 !         215 !         225
 DATA DEFINED     ! CYL !       1,164 !       1,164 !       1,164 !       1,164
 DATA USED        ! CYL !       1,138 !       1,073 !       1,068 !       1,070
 WORK DEFINED     ! CYL !          75 !          75 !          75 !          75
                  !     !             !             !             !
                  !     !             !             !             !
                  !     !             !             !             !
                  !     !             !             !             !
                  !     !             !             !             !
                  !     !             !             !             !
     Direct command ==> _______________________________________________________
Enter-PF1---PF2---PF3---PF4---PF5---PF6---PF7---PF8---PF9---PF10--PF11--PF12---
      Help  More  Term  Prof  prev  next  -     +     Cumul <     >     Menu
|
Figure 2-13: Report Format for Evaluation Type 1
Often the reports are too large to fit onto a screen, so only a portion of the report can be displayed at any one time. Initially, the top left corner of the table of values is displayed. The keys PF10 and PF11 can be used for scrolling on the horizontal axis, i.e. to the left or right respectively. The keys PF7 and PF8 can be used for scrolling on the vertical axis, i.e. up or down respectively. The number of the page on display is shown at the top of the screen, according to the following scheme:
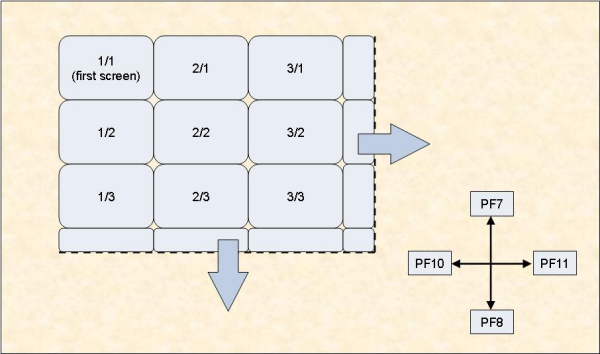
Figure 2-14: Report Page Layout
Note:
Scrolling is limited to 50 pages to the right and 50 pages down
(the maximum page number is 50/50).
For three-dimensional tables of values, the keys PF5 and PF6 are used for scrolling along the third axis. Figure 2-15 shows an example for Evaluation Type 1, in which the third axis contains a list of databases.
Alternatively, if you press PF4, an active help screen is displayed, containing a list of the values along the third axis. If you mark one of the choices, then press ENTER, the marked choice is selected.
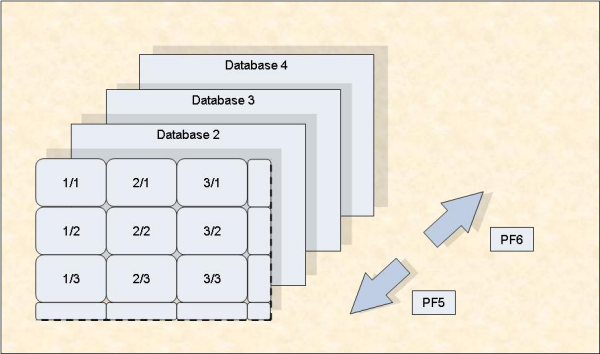
Figure 2-15: Scrolling on the third axis (example for Evaluation Type 1)
Note:
The third axis extends to a maximum of 50 levels.
Figure 2-1 in the ASF Examples documentation gives you an overview of the three dimensions for the evaluations of Type 1 - 8. Note that external accumulations, if available, are always performed along the horizontal axis.
The Evaluation Reports can be produced on the screen or hardcopy printer. They can also be downloaded to a PC using Entire Connection. The default output medium is the screen. You can, however, mark the field for the printer or PC-File when requesting an Evaluation Report using the ASF Online Menu System (see, for example, the menu "General Evaluation").
If you mark the field for output to a printer, you will be asked to give the name of the printer, the number of characters per line (80 or 132), and the size of the left margin, expressed as a number of characters.
When you download data to the PC, you can specify in the Entire Connection pop-up window the path, name, extension and type of the file. The full (F) and standard (X) download can use any available file type. The CSV (C) download should use the extension ".csv" and leave the file type unspecified.
When you run a Critical Report and the output "Printer" has been selected, ASF checks whether a Con-nect profile has been defined. In this case, ASF sends the report to the specified cabinets and to the printer.
If you run a Critical Report and the PC-File is marked with "E", the output is written to Workfile 1 in SMTP format and can be sent as e-mail. For more information see the section Critical Report.
In batch, ASF treats the output media "Screen" in the same way like "Printer". In both cases the output is routed into the Natural print file CMPRT01. If you specify "Screen" as output media for a predefined evaluation, you can test the evaluation online and run it later in batch without any modification.
If an ASF batch job specifies 'PC-File' as output medium, the output is routed into the Natural Workfile 7 (CMWKF07). When the PC-File is marked with "E" for a Critical Report, the output is written to Workfile 1 in SMTP format as described above.
In the General Evaluation, you can mark the field ‘PC-File’ with "X", "Y", "C", or "F" to download data to a PC-file.
| PC-File | Format | Layout | Description |
|---|---|---|---|
| X | Standard | 2D | Any PC spreadsheet format supported by Entire Connection can be selected. This is the default. |
| Y | Standard | 2D | Same as PC-File="X" but without header lines. |
| C | CSV | 2D | The data is written as comma-separated-values (CSV). |
| F | Full | 3D | The data is downloaded page by page similar to the screen output. Accumulation values are downloaded. |
The 3-dimensional (3D) layout looks like the screen output. The data is processed page by page and downloaded to the PC. The format depends on the evaluation type. The 3rd dimension is added to the bottom of the list. Accumulation values are downloaded as well.
When you mark the PC-File with "X", "Y" or "C", the data is downloaded in a 2-dimensional (2D) table. The first column contains the date and time, the second the DBID, and the third the file number (for evaluations 5-8). The other columns contain the data of the ASF data fields. Note that at most 201 columns can be downloaded. The format looks the same for all evaluation types 1 – 8.
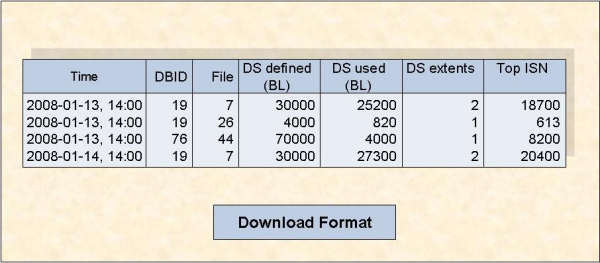
Figure 2-16: 2D-Layout of standard and CSV download
The 2D layout is much better applicable for evaluations with spreadsheet tools like Excel because each column contains data of one ASF field only. By default the data is sorted by the time. For one point in time, the DBID and files are listed in the sequence of the evaluation profile. The downloaded data can easy be sorted in another sequence, e.g. by specifying DBID, FILE-ID and Time as sort keys to analyze the values belonging to one file.
The 2D layout does not download accumulation values like MIN/MAX. This information is only downloaded with the Full format.
When the CSV download format is selected, ASF generates comma-separated-values. It uses the semicolon as separator. Empty columns and leading spaces are not downloaded. The later has the advantage that downloaded numeric values are recognized by Excel as numeric which easies the further processing. With the CSV download, the database and file names are downloaded in full length. Critical Reports and Critical Trends can also be downloaded in CSV format.
The download in the Standard format is in general faster than the Full format. Moreover if your target is an Excel file, the CSV format is considerably faster than the Standard format. Therefore it is recommended to use the CSV format if possible. A download performance test is presented in the Planning Guide.
If you want to process the downloaded data with spreadsheet tools like Excel, you should take care that the "Decimal character" setting in your User Profile is the same as in that tool. See the section User Profile Maintenance for information on how to modify your User Profile.