The Evaluation Profile SAG-IO-2 is one of a set of profiles provided with the ASF software. This section describes how the profile SAG-IO-2 was created, and analyses an Evaluation Report which was generated using SAG-IO-2.
This document covers the following topics:
The Profile SAG-IO-2 can be used for comparing the I/O behavior of several databases over a period of time. The profile uses Evaluation Type 2, which produces the most compact of the available display formats. The vertical axis of an Evaluation Report using this profile shows accumulated ASF fields, and the horizontal axis is a list of databases for which these ASF fields apply.
Figure 3-1 shows the ASF fields which SAG-IO-2 uses, and the types of accumulation for each field. The field READ ASSO, for example, is included in the profile, and its minimum, maximum and average values will be displayed in an Evaluation Report generated using SAG-IO-2.
Field Name ! Seq ! Min ! Max ! Sum ! Avr ! Val ! Disp ! Det -----------------+-----+-----+-----+-----+-----+-----+------+--------- DATE NUC-START__ ! __1 ! __ ! __ ! __ ! __ ! __ ! __ ! __ TIME NUC-START__ ! __2 ! __ ! __ ! __ ! __ ! __ ! __ ! __ READ ASSO_______ ! __3 ! X_ ! X_ ! __ ! X_ ! __ ! __ ! __ READ DATA_______ ! __4 ! X_ ! X_ ! __ ! X_ ! __ ! __ ! __ READ WORK_______ ! __5 ! X_ ! X_ ! __ ! X_ ! __ ! __ ! __ WRITE ASSO______ ! __6 ! X_ ! X_ ! __ ! X_ ! __ ! __ ! __ WRITE DATA______ ! __7 ! X_ ! X_ ! __ ! X_ ! __ ! __ ! __ WRITE WORK______ ! __8 ! X_ ! X_ ! __ ! X_ ! __ ! __ ! __ WRITE PLOG______ ! __9 ! X_ ! X_ ! __ ! X_ ! __ ! __ ! __ LOG. READS______ ! _10 ! X_ ! X_ ! __ ! X_ ! __ ! __ ! __ BUFF. EFFICIENCY ! _11 ! X_ ! X_ ! __ ! X_ ! __ ! __ ! __ |
Figure 3-1: Accumulation for SAG-IO-2
Figure 3-2 shows the units of measurement defined for the ASF fields in SAG-IO-2. Many of the ASF fields in SAG-IO-2 are marked for output as "1/min", i.e. as a number of occurrences per minute since the Adabas Nucleus was started. This is a useful way of displaying the ASF fields which represent I/O activity (READ ASSO, WRITE ASSO etc.).
! ! ! ! Da ! Hr ! Se ! ! ! 1/call Field Name ! Seq ! Default ! Bl ! Cy ! MB ! BY ! % ! Nom ! 1/min -----------------+-----+---------+----+----+----+----+----+-----+------ DATE NUC-START__ ! __1 ! ! __ ! __ ! __ ! __ ! __ ! __ ! __ TIME NUC-START__ ! __2 ! ! __ ! __ ! __ ! __ ! __ ! __ ! __ READ ASSO_______ ! __3 ! ! __ ! __ ! __ ! __ ! __ ! __ ! X_ READ DATA_______ ! __4 ! ! __ ! __ ! __ ! __ ! __ ! __ ! X_ READ WORK_______ ! __5 ! ! __ ! __ ! __ ! __ ! __ ! __ ! X_ WRITE ASSO______ ! __6 ! ! __ ! __ ! __ ! __ ! __ ! __ ! X_ WRITE DATA______ ! __7 ! ! __ ! __ ! __ ! __ ! __ ! __ ! X_ WRITE WORK______ ! __8 ! ! __ ! __ ! __ ! __ ! __ ! __ ! X_ WRITE PLOG______ ! __9 ! ! __ ! __ ! __ ! __ ! __ ! __ ! __ LOG. READS______ ! _10 ! ! __ ! __ ! __ ! __ ! __ ! __ ! X_ BUFF. EFFICIENCY ! _11 ! ! __ ! __ ! __ ! __ ! __ ! __ ! __ |
Figure 3-2: Units for SAG-IO-2
Note:
The following paragraphs describe how the Evaluation Profile
SAG-IO-2 was created. The method shown here can be used as a reference when
creating new Evaluation Profiles.
The profile SAG-IO-2 is one of the standard Evaluation Profiles provided with ASF. When originally creating this profile, the function E in the ASF Main Menu was selected, which caused the menu "Evaluation profile administration" to appear. In this menu, the function A (to add an evaluation profile) was selected. In reply to the prompt "Profile" the name SAG-IO-2 was typed in. The Evaluation Type 2 was chosen. After pressing ENTER a window appeared into which the alias name "SI2" was typed. Subsequently the menu "Profile Element: Accumulation" appeared.
When the menu "Profile Element: Accumulation" was selected, the cursor was positioned automatically on the first input field of the menu. At this stage, the field names could have been entered directly into the mask (DATE-NUC-START, TIME NUC-START etc.), but the quicker method of using active help was used. Typing an asterisk in the first input field as shown in Figure 3-3, then pressing ENTER caused the first active help screen to be displayed. You can also press PF5 to access the active help screen.
Field Name ! Seq ! Min ! Max ! Sum ! Avr ! Val ! Disp ! Det -----------------+-----+-----+-----+-----+-----+-----+------+--------- *_______________ ! ___ ! __ ! __ ! __ ! __ ! __ ! __ ! __ ________________ ! ___ ! __ ! __ ! __ ! __ ! __ ! __ ! __ |
Figure 3-3: Selecting Active Help for ASF Fields
The first help screen displays the ASF groups. We mark the "IO-Data" group with "A", because we want to use all fields of this group. The "Session Information" group is marked with "X" for further selection.
18:41:19           **** A D A B A S Statistics Facility ****        2008-02-07
                       - Profile element : Accumulation -           MPXK0001

  +---------------------< Select groups    page  1 >---------------< ALL >--+
  !                                                                         !
  !  Mk Nr. Group Name         Sel Max ! Mk Nr. Group name         Sel Max  !
  !  ----------------------------------+----------------------------------  !
  !  __   1 ADARUN-Parameter     0  25 ! __  11 High water marks     0   8  ! >
  !  X_   2 Session Informatio   0  16 ! __  13 Tech. ASF fields     0  17  !
  !  __   3 Physical DB-Layout   0   9 ! __  14 User defined field   0  20  !
  !  A_   4 IO-Data              0   9 !                                    !
  !  __   5 Cmd distr. source    0   4 !                                    !
  !  __   6 Cmd distr. thread    0 251 !                                    !
  !  __   7 Cmd distr. type      0  22 !                                    !
  !  __   8 User calls           0   6 !                                    !
  !  __   9 Run time info        0   7 !                                    !
  !  __  10 Call duration (mil   0  21 !                                    !
  !                                             Total ............     415  !
  +-------------------------------------------------------------------------+

     Direct command ==> _______________________________________________________
Enter-PF1---PF2---PF3---PF4---PF5---PF6---PF7---PF8---PF9---PF10--PF11--PF12---
Help More Term All Selct Menu |
Figure 3-4: Active help - Group selection
Because the "Session Information" group in the group selection was marked with an "X", the screen "Select fields of group" is displayed. Here we see the fields of this group in detail. We place a mark beside the fields required, as shown in Figure 3-5.
18:41:19           **** A D A B A S Statistics Facility ****        2008-02-07
                       - Profile element : Accumulation -           MPXK0001

  +---< Select fields of group 2: 'Session Information' page  1 >--< ALL >--+
  !                                                                         !
  !  Mk Nr. Field name          State  ! Mk Nr.Field name           State   !
  !  ----------------------------------+----------------------------------  !
  !  __  29 DBID                       ! __  39 DURATION                    ! >
  !  __  30 DB-NAME                    ! __  40 WAIT-TIME                   !
  !  __  31 SVC                        ! __  41 CPU-TIME                    !
  !  __  32 NUCID                      ! X_  42 DATE NUC-START              !
  !  __  33 VERSION                    ! X_  43 TIME NUC-START              !
  !  __  34 DATE LOADED                ! __  44 NUC-RUN-TIME                !
  !  __  35 TIME LOADED                !                                    !
  !  __  36 MAXNR OF FILES             !                                    !
  !  __  37 NR FILES LOADED            !                                    !
  !  __  38 CURR. LOG TAPE             !                                    !
  !                                                                         !
  +-------------------------------------------------------------------------+

     Direct command ==> _______________________________________________________
Enter-PF1---PF2---PF3---PF4---PF5---PF6---PF7---PF8---PF9---PF10--PF11--PF12---
Help More Term Selct - + Prev Next Menu |
Figure 3-5: Active help - Field selection
Subsequently we press PF6 in order to select the marked fields. The screen "Select groups" is displayed again and it now indicates the number of selected fields. We leave this screen again with PF6.
If the names of the ASF fields had been typed in manually instead of using the active help feature, all available input fields would have been used after typing the 10th ASF field name. Since the Evaluation Profile SAG-IO-2 contains more than 10 ASF fields, it would have been necessary to use the PF8 key to page forward by one screen. When paging forward in this manner, the last ASF field on the previous screen is displayed as the first field on the new screen. The PF7 key is used to scroll backwards.
You might wish to use the profile SAG-IO-2 as a starting point in defining a new Evaluation Profile. Do not modify SAG-IO-2 but create a new Evaluation Profile which is a copy of SAG-IO-2 and modify the copy. To create a copy of SAG-IO-2, select the function "Evaluation-profile administration" in the ASF main menu, then use the function "Copy an Evaluation profile".
If you wish to add ASF fields to those which are already defined in your new Evaluation Profile, the simplest way to do this is to select the active help feature by typing an asterisk ("*") in any input field (even if the field already contains an ASF field name) and pressing ENTER. Alternatively you can press the PF5 key to add new fields to the end of the list. In both cases, the active help screen "Select groups" is displayed. The number of fields already selected is outlined in the column "Sel" for each group. Mark one or more groups with "X" to enter the active help screen "Select fields of group". This time, the already selected fields are marked with "X" in the State column. Mark a field with "X" to include it into the profile, or mark it with "D" to deselect it. When you have marked all the new fields, press PF6 to save the changes.
If you wish to delete fields from your newly created profile, move the cursor to the name of the field in any of the "Profile Element" screens, then overwrite the field name with blanks or press the DELETE FIELD key, then press ENTER. Alternatively, you can select the active help screen and deselect an entire group or a single field by marking it with "D". Subsequently pressing PF6 will store the change.
If you wish to change the order in which the ASF fields appear, the simplest way is to overwrite the values in the "Seq" column of the "Profile Element" screens accordingly. If, for example, you want the field "TIME NUC-START" to appear before the field "DATE NUC-START" in your copy of SAG-IO-2, then overwrite the "2" in the "Seq" column beside "TIME NUC-START" with the value "1". After you press ENTER, "TIME NUC-START" will appear in the first position, and "DATE NUC-START" will have been moved down one row.
Like most delivered Evaluation Profiles, SAG-IO-2 does not specify databases. Thus, when you make a copy of this profile and you want to restrict the databases to specific ones, you must modify the copy to contain the numbers of the databases which you wish to evaluate. When you press PF4 in any of the "Profile Element" screens, the screen "Link databases to profile" is selected. Type in the numbers of the databases which are to be evaluated, and press PF6 to save the changes to the profile.
As SAG-IO-2 is evaluation type 2, no files are included in the profile.
Note:
If your ASF Profile file was loaded with ASF version 7.1 or before,
the profile SAG-IO-2 specifies databases for which test data exists in the
sample database provided as part of the ASF product. Thus, when you make a copy
of this profile, you must modify the copy to reflect the databases which you
wish to evaluate.
When an Evaluation Report is generated, the data it contains is based on ASF data which was stored by the Store Program. If you wish to test a new Evaluation Profile, but do not yet have suitable stored data, you can generate a set of data as follows. Run the Store Program online from the ASF main menu, specifying the Store Type AH (ad hoc) and a Store Profile containing the databases which are required for the Evaluation Report.
The screen for running the evaluation is accessed from the main menu using the function G (General Evaluation). The test ASF data which will be evaluated is supplied as part of the ASF product. The evaluation will access all ASF records which have the Store Type WE and were stored using the Store Profile TEST-DB-ALL, and which were created in 1992 or later. Figure 3-6 shows the input required to start the evaluation.
19:00:46          *** A D A B A S  Statistics Facility ***          2008-02-07
USERID                    - General evaluation -                    MSA00001

                   Code                 Service
                 -------  -------------------------------------
                    S     Start general evaluation
                    ?     Help
                    .     Terminate
                 -------  -------------------------------------
       Enter code : _

    Eval. profile : SAG-IO-2________
  Evaluation type : 2_ DBases in time frame (DB) V:Fields H:Databases
  Time frame from : 1992-01-01 , 00:00  to  +0________ , 19:00

    Store profile : TEST-DB-ALL_____
       Store type : WE weekly storage
           Origin : NU_ Nucleus records
           Screen : X  Printer : _  PC-File : _

     Direct command ==> _______________________________________________________
Enter-PF1---PF2---PF3---PF4---PF5---PF6---PF7---PF8---PF9---PF10--PF11--PF12---
Help More Term Capt Menu |
Figure 3-6: Example of Starting an Evaluation
Running the evaluation as shown in Figure 3-6 causes an Evaluation Report to be generated on the screen. The evaluation can also be output on a hardcopy printer, or downloaded to a PC. The following sections describe the format of the Evaluation Report.
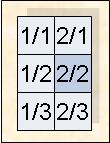
The Evaluation Report produced by the General Evaluation, as described in the previous sections, is too large to fit onto one screen, so the output is divided into screen-sized pages according to the scheme shown in Figure 3-7.
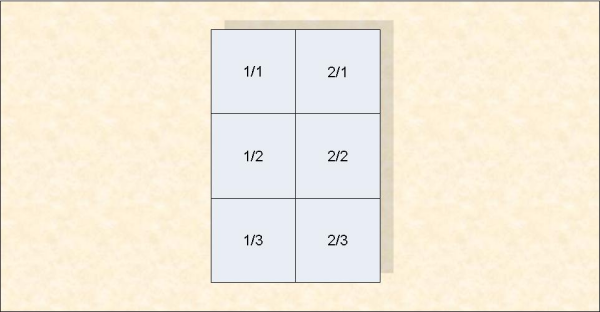
Figure 3-7: Output Pages of an Evaluation Report on screen
The six pages 1/1 to 2/3 of the Evaluation Report are shown in Figure 3-8 to Figure 3-13. To aid orientation, a small version of Figure 3-7 precedes each diagram, with the appropriate page shaded.
07:48:23        *** A D A B A S  Statistics Facility  ***           2008-02-08
USERID      < from  1992-01-01 00:00  to  2008-02-08 07:45 >   1/1  MEV26001

 DBID             !UNIT ACC !         16 !         17 !         26 !         36
 DB-NAME          !         !DB016-ALSBA !DB017-ANWEN ! SPL-MIRROR !DB036-ALSBA
 #COUNTER         !         !          6 !          6 !          6 !          6
 -----------------+---------+------------+------------+------------+-----------
 DATE NUC-START   !         ! 1992-04-13 ! 1992-04-13 ! 1992-04-13 ! 1992-04-13
 TIME NUC-START   !         !      02:40 !      02:45 !      02:42 !      02:37
 READ ASSO        ! PM  MIN !       18.0 !      104.1 !       25.7 !       32.8
 READ ASSO        ! PM  MAX !       49.0 !      240.0 !      271.1 !       45.8
 READ ASSO        ! PM  AVR !       30.6 !      140.3 !       83.0 !       39.8
 READ DATA        ! PM  MIN !       16.0 !      184.2 !       19.9 !       31.0
 READ DATA        ! PM  MAX !       70.1 !      490.8 !      125.1 !       76.5
 READ DATA        ! PM  AVR !       34.4 !      258.8 !       50.2 !       49.9
 READ WORK        ! PM  MIN !        0.0 !        0.4 !        0.0 !        0.0
 READ WORK        ! PM  MAX !        0.1 !        1.6 !        0.3 !        0.2
 READ WORK        ! PM  AVR !        0.0 !        0.7 !        0.1 !        0.1
 WRITE ASSO       ! PM  MIN !        1.7 !       26.0 !        9.3 !        4.1
 WRITE ASSO       ! PM  MAX !       17.7 !       74.2 !       97.2 !        8.4
     Direct command ==> _______________________________________________________
Enter-PF1---PF2---PF3---PF4---PF5---PF6---PF7---PF8---PF9---PF10--PF11--PF12---
Help More Term - + < > Menu |
Figure 3-8: First screen of Evaluation Report
07:49:08        *** A D A B A S  Statistics Facility  ***           2008-02-08
USERID       < from  1992-01-01 00:00  to  2008-02-08 07:45 >  2/1  MEV26001

 DBID             !UNIT ACC !         37 !            !            !
 DB-NAME          !         !ENTIRE-ALSB !            !            !
 #COUNTER         !         !          6 !            !            !
 -----------------+---------+------------+------------+------------+-----------
 DATE NUC-START   !         ! 1992-04-13 !            !            !
 TIME NUC-START   !         !      02:52 !            !            !
 READ ASSO        ! PM  MIN !      103.7 !            !            !
 READ ASSO        ! PM  MAX !      211.5 !            !            !
 READ ASSO        ! PM  AVR !      147.2 !            !            !
 READ DATA        ! PM  MIN !       56.4 !            !            !
 READ DATA        ! PM  MAX !      176.0 !            !            !
 READ DATA        ! PM  AVR !      107.4 !            !            !
 READ WORK        ! PM  MIN !        0.2 !            !            !
 READ WORK        ! PM  MAX !        4.5 !            !            !
 READ WORK        ! PM  AVR !        1.1 !            !            !
 WRITE ASSO       ! PM  MIN !       12.7 !            !            !
 WRITE ASSO       ! PM  MAX !       77.0 !            !            !
     Direct command ==> _______________________________________________________
Enter-PF1---PF2---PF3---PF4---PF5---PF6---PF7---PF8---PF9---PF10--PF11--PF12---
Help More Term - + < > Menu |
Figure 3-9: Screen 2/1 of Evaluation Report
07:49:48        *** A D A B A S  Statistics Facility  ***           2008-02-08
USERID      < from  1992-01-01 00:00  to  2008-02-08 07:45 >   1/2  MEV26001

 DBID             !UNIT ACC !         16 !         17 !         26 !         36
 DB-NAME          !         !DB016-ALSBA !DB017-ANWEN ! SPL-MIRROR !DB036-ALSBA
 #COUNTER         !         !          6 !          6 !          6 !          6
 -----------------+---------+------------+------------+------------+-----------
 WRITE ASSO       ! PM  AVR !        5.5 !       49.1 !       36.1 !        6.2
 WRITE DATA       ! PM  MIN !        0.3 !       13.6 !        1.6 !        3.0
 WRITE DATA       ! PM  MAX !        3.6 !      166.3 !       17.1 !       19.0
 WRITE DATA       ! PM  AVR !        1.8 !       41.1 !        6.6 !        8.7
 WRITE WORK       ! PM  MIN !        1.7 !       22.7 !        2.8 !        8.1
 WRITE WORK       ! PM  MAX !       28.0 !      197.6 !       38.9 !       26.6
 WRITE WORK       ! PM  AVR !       14.3 !       56.1 !       19.4 !       18.0
 WRITE PLOG       !     MIN !          0 !          0 !          0 !          0
 WRITE PLOG       !     MAX !          0 !          0 !          0 !          0
 WRITE PLOG       !     AVR !          0 !          0 !          0 !          0
 LOG. READS       ! PM  MIN !      679.9 !     4026.7 !      441.8 !     1023.1
 LOG. READS       ! PM  MAX !     4075.6 !    11656.2 !     6312.3 !     5459.2
 LOG. READS       ! PM  AVR !     2267.1 !     5984.1 !     2890.3 !     2241.3
     Direct command ==> _______________________________________________________
Enter-PF1---PF2---PF3---PF4---PF5---PF6---PF7---PF8---PF9---PF10--PF11--PF12---
Help More Term - + < > Menu |
Figure 3-10: Screen 1/2 of Evaluation Report
07:50:46        *** A D A B A S  Statistics Facility  ***           2008-02-08
USERID      < from  1992-01-01 00:00  to  2008-02-08 07:45 >   2/2  MEV26001

 DBID             !UNIT ACC !         37 !            !            !
 DB-NAME          !         !ENTIRE-ALSB !            !            !
 #COUNTER         !         !          6 !            !            !
 -----------------+---------+------------+------------+------------+-----------
 WRITE ASSO       ! PM  AVR !       29.5 !            !            !
 WRITE DATA       ! PM  MIN !        7.1 !            !            !
 WRITE DATA       ! PM  MAX !       32.8 !            !            !
 WRITE DATA       ! PM  AVR !       16.7 !            !            !
 WRITE WORK       ! PM  MIN !       10.9 !            !            !
 WRITE WORK       ! PM  MAX !       47.3 !            !            !
 WRITE WORK       ! PM  AVR !       26.2 !            !            !
 WRITE PLOG       !     MIN !          0 !            !            !
 WRITE PLOG       !     MAX !          0 !            !            !
 WRITE PLOG       !     AVR !          0 !            !            !
 LOG. READS       ! PM  MIN !     3317.0 !            !            !
 LOG. READS       ! PM  MAX !     9922.7 !            !            !
 LOG. READS       ! PM  AVR !     6353.1 !            !            !
     Direct command ==> _______________________________________________________
Enter-PF1---PF2---PF3---PF4---PF5---PF6---PF7---PF8---PF9---PF10--PF11--PF12---
Help More Term - + < > Menu |
Figure 3-11: Screen 2/2 of Evaluation Report
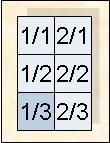
07:51:20        *** A D A B A S  Statistics Facility  ***           2008-02-08
USERID      < from  1992-01-01 00:00  to  2008-02-08 07:45 >   1/3  MEV26001

 DBID             !UNIT ACC !         16 !         17 !         26 !         36
 DB-NAME          !         !DB016-ALSBA !DB017-ANWEN ! SPL-MIRROR !DB036-ALSBA
 #COUNTER         !         !          6 !          6 !          6 !          6
 -----------------+---------+------------+------------+------------+-----------
 BUFF. EFFICIENCY !     MIN !       19.6 !       13.2 !        8.9 !       15.8
 BUFF. EFFICIENCY !     MAX !       44.8 !       15.9 !      119.5 !       63.7
 BUFF. EFFICIENCY !     AVR !       33.4 !       14.8 !       32.1 !       25.1
                  !         !            !            !            !
                  !         !            !            !            !
                  !         !            !            !            !
                  !         !            !            !            !
                  !         !            !            !            !
                  !         !            !            !            !
                  !         !            !            !            !
                  !         !            !            !            !
                  !         !            !            !            !
                  !         !            !            !            !
     Direct command ==> _______________________________________________________
Enter-PF1---PF2---PF3---PF4---PF5---PF6---PF7---PF8---PF9---PF10--PF11--PF12---
Help More Term - + < > Menu |
Figure 3-12: Screen 1/3 of Evaluation Report
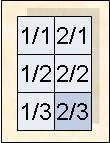
07:51:48        *** A D A B A S  Statistics Facility  ***           2008-02-08
USERID      < from  1992-01-01 00:00  to  2008-02-08 07:45 >   2/3  MEV26001

 DBID             !UNIT ACC !         37 !            !            !
 DB-NAME          !         !ENTIRE-ALSB !            !            !
 #COUNTER         !         !          6 !            !            !
 -----------------+---------+------------+------------+------------+-----------
 BUFF. EFFICIENCY !     MIN !       20.6 !            !            !
 BUFF. EFFICIENCY !     MAX !       33.7 !            !            !
 BUFF. EFFICIENCY !     AVR !       24.4 !            !            !
                  !         !            !            !            !
                  !         !            !            !            !
                  !         !            !            !            !
                  !         !            !            !            !
                  !         !            !            !            !
                  !         !            !            !            !
                  !         !            !            !            !
                  !         !            !            !            !
                  !         !            !            !            !
                  !         !            !            !            !
     Direct command ==> _______________________________________________________
Enter-PF1---PF2---PF3---PF4---PF5---PF6---PF7---PF8---PF9---PF10--PF11--PF12---
Help More Term - + < > Menu |
Figure 3-13: Screen 2/3 of Evaluation Report
To scroll through the Evaluation Report on the screen, use PF7 (up), PF8 (down), PF10 (left), PF11 (right). The PF-keys PF5 and PF& are not used since the report has no third dimension.
If the report is being output to a printer, it is possible to display many more lines of output per page than on a screen. The Evaluation Report shown in Figure 3-8 to Figure 3-13 for screen output requires only 1 page vertically when output to a printer. In addition, if the printer outputs 132 characters per line, then the number of pages required in the horizontal direction will be correspondingly reduced. The format of the Evaluation Report produced on both 80-column and 132-column printers is described in the following section.

Figure 3-14: Page numbers (Printer with 80 characters per line)
If the evaluation is output on a printer with 80 characters per line, only two pages of output will be produced. Figure 3-15 shows the format of the first page, and Figure 3-16 shows the format of the second page.
15:47:25 *** A D A B A S Statistics Facility *** 2008-02-08 USERID < from 1992-01-01 00:00 to 2008-02-11 15:16> 1/1 page 1 PEV26001 Store-type : WE Store-profile : TEST-DB-ALL Profile: SAG-IO-2 Eval-Type: 2 DBases in time frame (DB) V:Fields H:Databases DBID !UNIT ACC ! 16 ! 17 ! 26 ! 36 DB-NAME ! !DB016-ALSBA !DB017-ANWEN ! SPL-MIRROR !DB036-ALSBA #COUNTER ! ! 6 ! 6 ! 6 ! 6 -----------------+---------+------------+------------+------------+----------- DATE NUC-START ! ! 1992-04-13 ! 1992-04-13 ! 1992-04-13 ! 1992-04-13 TIME NUC-START ! ! 02:40 ! 02:45 ! 02:42 ! 02:37 READ ASSO ! PM MIN ! 18.0 ! 104.1 ! 25.7 ! 32.8 READ ASSO ! PM MAX ! 49.0 ! 240.0 ! 271.1 ! 45.8 READ ASSO ! PM AVR ! 30.6 ! 140.3 ! 83.0 ! 39.8 READ DATA ! PM MIN ! 16.0 ! 184.2 ! 19.9 ! 31.0 READ DATA ! PM MAX ! 70.1 ! 490.8 ! 125.1 ! 76.5 READ DATA ! PM AVR ! 34.4 ! 258.8 ! 50.2 ! 49.9 READ WORK ! PM MIN ! 0.0 ! 0.4 ! 0.0 ! 0.0 READ WORK ! PM MAX ! 0.1 ! 1.6 ! 0.3 ! 0.2 READ WORK ! PM AVR ! 0.0 ! 0.7 ! 0.1 ! 0.1 WRITE ASSO ! PM MIN ! 1.7 ! 26.0 ! 9.3 ! 4.1 WRITE ASSO ! PM MAX ! 17.7 ! 74.2 ! 97.2 ! 8.4 WRITE ASSO ! PM AVR ! 5.5 ! 49.1 ! 36.1 ! 6.2 WRITE DATA ! PM MIN ! 0.3 ! 13.6 ! 1.6 ! 3.0 WRITE DATA ! PM MAX ! 3.6 ! 166.3 ! 17.1 ! 19.0 WRITE DATA ! PM AVR ! 1.8 ! 41.1 ! 6.6 ! 8.7 WRITE WORK ! PM MIN ! 1.7 ! 22.7 ! 2.8 ! 8.1 WRITE WORK ! PM MAX ! 28.0 ! 197.6 ! 38.9 ! 26.6 WRITE WORK ! PM AVR ! 14.3 ! 56.1 ! 19.4 ! 18.0 WRITE PLOG ! MIN ! 0 ! 0 ! 0 ! 0 WRITE PLOG ! MAX ! 0 ! 0 ! 0 ! 0 WRITE PLOG ! AVR ! 0 ! 0 ! 0 ! 0 LOG. READS ! PM MIN ! 679.9 ! 4026.7 ! 441.8 ! 1023.1 LOG. READS ! PM MAX ! 4075.6 ! 11656.2 ! 6312.3 ! 5459.2 LOG. READS ! PM AVR ! 2267.1 ! 5984.1 ! 2890.3 ! 2241.3 BUFF. EFFICIENCY ! MIN ! 19.6 ! 13.2 ! 8.9 ! 15.8 BUFF. EFFICIENCY ! MAX ! 44.8 ! 15.9 ! 119.5 ! 63.7 BUFF. EFFICIENCY ! AVR ! 33.4 ! 14.8 ! 32.1 ! 25.1 |
Figure 3-15: Evaluation report (page 1) on printer (80 characters per line)
15:48:28 *** A D A B A S Statistics Facility *** 2008-02-08 USERID < from 1992-01-01 00:00 to 2008-02-11 15:16> 2/1 page 1 PEV26001 Store-type : WE Ad hoc Store-profile : TEST-DB-ALL Profile: SAG-IO-2 Eval-Type: 2 DBases in time frame (DB) V:Fields H:Databases DBID ! UNIT ACC! 37 ! ! ! DB-NAME ! !ENTIRE-ALSB ! ! ! #COUNTER ! ! 6 ! ! ! -----------------+---------+------------+------------+------------+----------- DATE NUC-START ! ! 1992-04-13 ! ! ! TIME NUC-START ! ! 02:52 ! ! ! READ ASSO ! PM MIN ! 103.7 ! ! ! READ ASSO ! PM MAX ! 211.5 ! ! ! READ ASSO ! PM AVR ! 147.2 ! ! ! READ DATA ! PM MIN ! 56.4 ! ! ! READ DATA ! PM MAX ! 176.0 ! ! ! READ DATA ! PM AVR ! 107.4 ! ! ! READ WORK ! PM MIN ! 0.2 ! ! ! READ WORK ! PM MAX ! 4.5 ! ! ! READ WORK ! PM AVR ! 1.1 ! ! ! WRITE ASSO ! PM MIN ! 12.7 ! ! ! WRITE ASSO ! PM MAX ! 77.0 ! ! ! WRITE ASSO ! PM AVR ! 29.5 ! ! ! WRITE DATA ! PM MIN ! 7.1 ! ! ! WRITE DATA ! PM MAX ! 32.8 ! ! ! WRITE DATA ! PM AVR ! 16.7 ! ! ! WRITE WORK ! PM MIN ! 10.9 ! ! ! WRITE WORK ! PM MAX ! 47.3 ! ! ! WRITE WORK ! PM AVR ! 26.2 ! ! ! WRITE PLOG ! MIN ! 0 ! ! ! WRITE PLOG ! MAX ! 0 ! ! ! WRITE PLOG ! AVR ! 0 ! ! ! LOG. READS ! PM MIN ! 3317.0 ! ! ! LOG. READS ! PM MAX ! 9922.7 ! ! ! LOG. READS ! PM AVR ! 6353.1 ! ! ! BUFF. EFFICIENCY ! MIN ! 20.6 ! ! ! BUFF. EFFICIENCY ! MAX ! 33.7 ! ! ! BUFF. EFFICIENCY ! AVR ! 24.4 ! ! ! |
Figure 3-16: Evaluation report (page 2) on printer (80 characters per line)
On a printer with 132 characters per line, the Evaluation Report fits entirely onto one output page, as indicated in Figure 3-17. The format is the same as for a printer with 80 characters per line, except that the extra page width allows more columns to be displayed.

Figure 3-17: Page numbers (Printer with 132 characters per line)
When the data is downloaded to the PC with PC-File = X (standard download), the first line indicates the ASF field name and the second line the corresponding unit. The first column contains the date and time, the second column the DBID. For file related evaluations (type 5-8) the third column would contain the file number. The other columns contain the evaluated data. Up to 201 columns can be downloaded. The downloaded data contains empty columns on the right because a fix number of columns must be downloaded (25, 51, 101 or 201). Each data field contains blanks which must be removed before the data can be processed in Excel or other tools.
The standard download does not perform any accumulation. The original values are downloaded.
Download elapsed time: 6 sec
| Time | DBID | DATE NUC-START | TIME NUC-START | READ ASSO | READ DATA | READ WORK |
|---|---|---|---|---|---|---|
| Unit -> | PM | PM | PM | |||
| 1992-03-09/17:34 | 16 | 1992-03-09 | 02:32 | 18.6 | 16.0 | 0.0 |
| 1992-03-09/17:34 | 17 | 1992-03-09 | 07:06 | 240.0 | 490.8 | 0.7 |
| 1992-03-09/17:34 | 26 | 1992-03-09 | 07:07 | 60.7 | 48.9 | 0.3 |
| 1992-03-09/17:34 | 36 | 1992-03-09 | 02:32 | 32.8 | 31.0 | 0.0 |
| 1992-03-09/17:34 | 37 | 1992-03-09 | 02:49 | 211.5 | 176.0 | 4.5 |
| 1992-03-16/23:00 | 16 | 1992-03-16 | 02:41 | 25.1 | 25.9 | 0.1 |
Figure 3-19: Evaluation report standard download (part)
When the data is downloaded to the PC with PC-File = C (CSV download), the first line indicates the ASF field name and the corresponding unit (in brackets). The first column contains the date and time, the second column the DBID. For file related evaluations (type 5-8) the third column would contain the file number. The other columns contain the evaluated data. Up to 201 columns can be downloaded. Only columns containing data are downloaded (no empty columns). The data fields do not contain blanks and can be processed as-are.
The CSV download does not perform any accumulation. The original values are downloaded.
Download elapsed time: < 1 sec
| Time | DBID | DATE NUC-START | TIME NUC-START | READ ASSO (PM) | READ DATA (PM) | READ WORK (PM) |
|---|---|---|---|---|---|---|
| 1992-03-09/17:34 | 16 | 1992-03-09 | 02:32 | 18.6 | 16.0 | 0.0 |
| 1992-03-09/17:34 | 17 | 1992-03-09 | 07:06 | 240.0 | 490.8 | 0.7 |
| 1992-03-09/17:34 | 26 | 1992-03-09 | 07:07 | 60.7 | 48.9 | 0.3 |
| 1992-03-09/17:34 | 36 | 1992-03-09 | 02:32 | 32.8 | 31.0 | 0.0 |
| 1992-03-09/17:34 | 37 | 1992-03-09 | 02:49 | 211.5 | 176.0 | 4.5 |
| 1992-03-16/23:00 | 16 | 1992-03-16 | 02:41 | 25.1 | 25.9 | 0.1 |
Figure 3-20: Evaluation report CSV download (part)
When the data is downloaded to the PC with PC-File = F (full download), the result has the same layout as on the screen. The data is processed from top to bottom, left to right and finally through the third dimension until the end is reached.
Normally the first column of the downloaded data contains the value of the third dimension: for example, the DBID for an evaluation of Type 1. For Type 2 there is no third dimension, therefore this column is not used. The next column identifies the vertical axis: e.g. for an evaluation of Type 2, these are the ASF field names. The next column contains information like the unit or the type of the internal accumulation. Finally there are 100 columns containing the evaluated data.
If the report contains more than 100 data columns, the remaining columns are outlined in another row. Since it is difficult to process such an output further with another tool, you are recommended to restrict the output to at most 100 columns.
The first line of the downloaded data contains header information like the ASF field names or DBID and file numbers.
The downloaded data contains empty columns on the right because a fix number of columns must be downloaded (103). Each data field contains blanks which must be removed before the data can be processed in Excel or other tools.
The full download performs the accumulations as specified in the profile. For Type 2 this means that only accumulated values are downloaded.
Download elapsed time: 24 sec
| ASF Field Name | Accu | Unit | 16 | 17 | 26 |
|---|---|---|---|---|---|
| DB016-ALSBA | DB017-ANWEN | SPL-MIRROR | |||
| 6 | 6 | 6 | |||
| **************** | **** | **** | ********* | ********* | ********* |
| DATE NUC-START | 1992-04-13 | 1992-04-13 | 1992-04-13 | ||
| ASF Field Name | Accu | Unit | 16 | 17 | 26 |
| TIME NUC-START | 02:40 | 02:45 | 02:42 | ||
| READ ASSO | MIN | PM | 18.0 | 104.1 | 25.7 |
| READ ASSO | MAX | PM | 49.0 | 240.0 | 271.1 |
| READ ASSO | AVR | PM | 30.6 | 140.3 | 83.0 |
Figure 3-21: Evaluation report full download (part)
For a presentation we are going to weight the DATA reads of the databases monitored. Additionally we would like to visualize the history of the DATA reads of the database with the most calls and compare this with the number of ASSO reads.
We edit the data downloaded in CSV format with Excel. The data is sorted by Time/DBID which is the sort sequence we need. For the first point in time (1992-03-09) we mark the cells in column "READ DATA (PM). The marked cells are indicated in the following table by bold format."
| Time | DBID | DATE NUC-START | TIME NUC-START | READ ASSO (PM) | READ DATA (PM) | READ WORK (PM) |
|---|---|---|---|---|---|---|
| 1992-03-09/17:34 | 16 | 1992-03-09 | 02:32 | 18.6 | 16.0 | 0.0 |
| 1992-03-09/17:34 | 17 | 1992-03-09 | 07:06 | 240.0 | 490.8 | 0.7 |
| 1992-03-09/17:34 | 26 | 1992-03-09 | 07:07 | 60.7 | 48.9 | 0.3 |
| 1992-03-09/17:34 | 36 | 1992-03-09 | 02:32 | 32.8 | 31.0 | 0.0 |
| 1992-03-09/17:34 | 37 | 1992-03-09 | 02:49 | 211.5 | 176.0 | 4.5 |
| 1992-03-16/23:00 | 16 | 1992-03-16 | 02:41 | 25.1 | 25.9 | 0.1 |
Figure 3-22: CSV download - Cells marked for visualization (DB compare)
With the help of the Chart Wizard we generate a pie chart of the marked values. As Category Labels we select the values in column "DBID". We change the standard colors and background to make it look smart. We set the options to display the values and percentages in the chart and adjust the title.
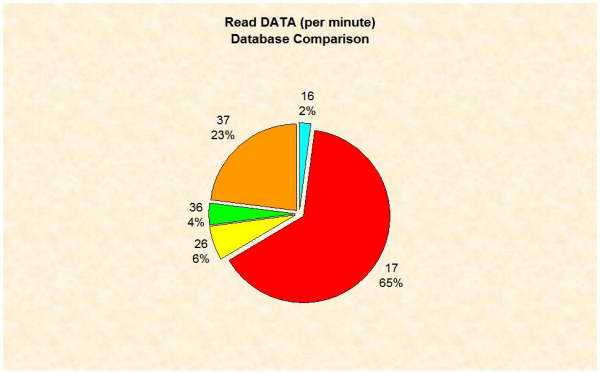
Figure 3-23: Visualization of DATA reads (database comparison)
Database 17 has issued the most DATA reads. For the history of DB 17, we copy the whole data sheet into a new sheet to avoid a mix-up with the first chart. We sort the data by DBID/Time so that the data belonging to one database is joined together. For DBID 17 we mark the cells in column "READ ASSO (PM)" and "READ DATA (PM)".
| Time | DBID | DATE NUC-START | TIME NUC-START | READ ASSO (PM) | READ DATA (PM) | READ WORK (PM) |
|---|---|---|---|---|---|---|
| 1992-03-09/17:34 | 17 | 1992-03-09 | 07:06 | 240 | 490.8 | 0.7 |
| 1992-03-16/23:00 | 17 | 1992-03-16 | 02:47 | 129.9 | 225 | 0.6 |
| 1992-03-23/23:00 | 17 | 1992-03-23 | 02:46 | 107.3 | 198.8 | 0.7 |
| 1992-03-30/22:00 | 17 | 1992-03-30 | 02:45 | 145.6 | 265.5 | 1.6 |
| 1992-04-06/22:12 | 17 | 1992-04-06 | 01:44 | 115.1 | 188.8 | 0.4 |
| 1992-04-13/23:12 | 17 | 1992-04-13 | 02:45 | 104.1 | 184.2 | 0.6 |
Figure 3-24: CSV download - Cells marked for visualization (history)
With the help of the Chart Wizard we generate a line chart of the marked values. As Category Labels we select the values in column "DATE NUC-START". We change the standard colors and background to make it look smart. We set the options to display the legend and adjust the titles.
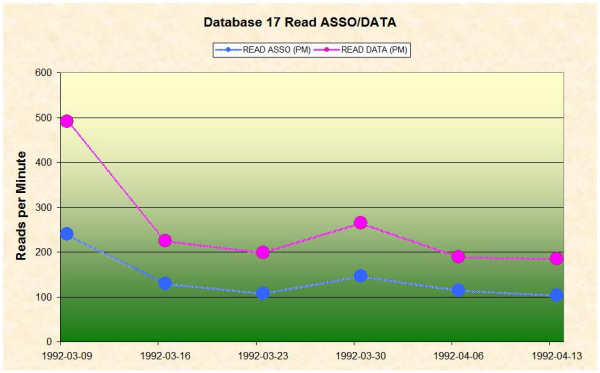
Figure 3-25: Visualization of ASSO/DATA reads (history of DB 17)