You can review the line drivers connected to an Entire Net-Work node. This document covers the following topics:
You can also review and ping databases on these remote nodes as described in Reviewing Database Statistics and Pinging Databases. These databases are listed in the Database list for the Entire Net-Work node as well as under each remote node in the remote node list (Nodes) for the Entire Net-Work node.
![]() To list the line drivers connected to an Entire Net-Work node:
To list the line drivers connected to an Entire Net-Work node:
Make sure you have accessed the System Management Hub.
Select the managed node from the list of Entire Net-Work managed nodes.
The statistics for the node appear in the detail-view frame.
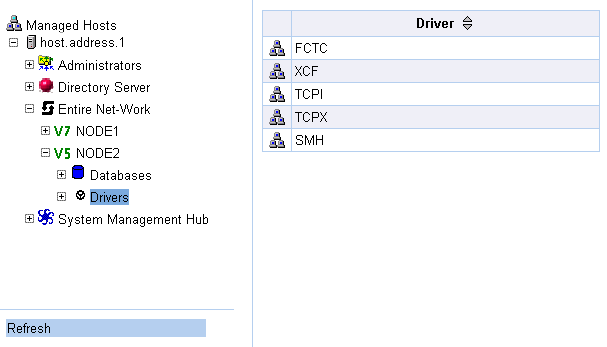
Select Drivers in the tree-view frame.
The list of line drivers appears in the detail-view frame.

![]() To review the link associated with a line driver:
To review the link associated with a line driver:
Make sure you have accessed the System Management Hub.
Select the managed node from the list of Entire Net-Work managed nodes.
The statistics for the node appear in the detail-view frame.
Select and expand Drivers in the tree-view frame.
The list of line drivers appears in the detail-view frame and beneath Drivers in the tree-view frame.
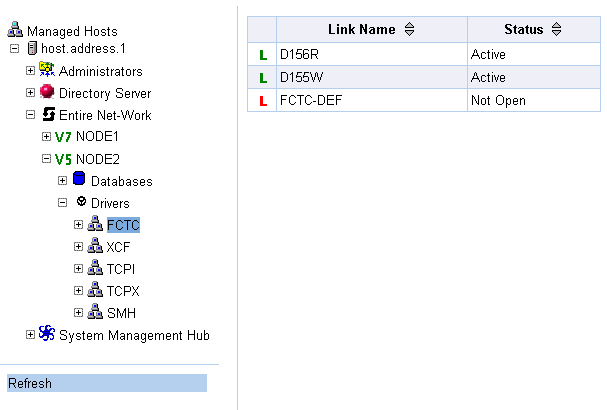
Select the line driver in the tree-view frame whose links you want to review.
The links for the line driver are listed in the detail-view frame.

These possible link statuses are described in the following table.
| Status | Description |
|---|---|
| Active | The link is connected and able to handle traffic. |
| Disconnected | The link is disconnected. |
| Not Open | The link is not open. The open may have failed, the driver may not be open, or the link or driver may have been closed manually. |
| Open | The link is connected but is not active. |
![]() To review link statistics:
To review link statistics:
Make sure you have accessed the System Management Hub.
Select the managed node from the list of Entire Net-Work managed nodes.
The statistics for the node appear in the detail-view frame.
Select and expand Drivers in the tree-view frame.
The list of line drivers appears in the detail-view frame and beneath Drivers in the tree-view frame.
Select and expand the line driver in the tree-view frame whose links you wish to review.
The links are listed in the detail-view frame and beneath the line driver in the tree-view frame.
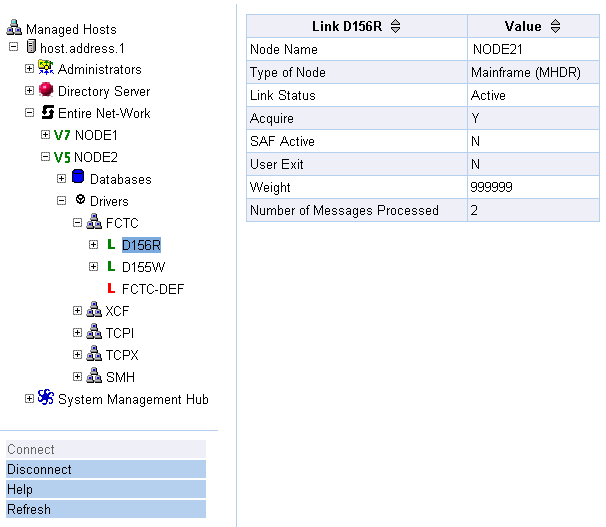
Select the link in the tree-view frame whose statistics you wish to review.
The link statistics appear in the detail-view frame.

These link statistics are described in the following table.
| Statistic | Description |
|---|---|
| Node Name | The name of the Entire Net-Work node connected to this link. |
| Type of Node | The platform followed by the internal message format; i.e., Mainframe (MHDR), or Workstation (PMSG). |
| Link Status |
Normally one of the following: Open - The link has been opened but is not active. Not Open - The link is not open. The open may have failed, the driver may not be open, or the link or driver may have been closed manually. Active - The link is connected and able to handle traffic. Disconnected - The link is disconnected. |
| Acquire | Not applicable. |
| SAF Active | The value of the SAF parameter on the TCPX LINK Statement ("Y", "L", or "N"). The default value is "N", meaning that Entire Net-Work will not call the SAF Interface for incoming requests on this link. |
| User Exit | Not applicable. |
| Weight | Not applicable. |
| Number of Messages Processed | The number of messages processed by this link since Entire Net-Work startup. |