
This document covers the following topics:
The Application Monitoring Data Collector collects the response time data of each involved software component of selected synchronous EntireX RPC, CICS ECI or IMS Connect services and stores it in CSV (comma-separated values) files.
MashZone is a browser-based application from Software AG which enables you to visualize any data from various, independently distributed data sources in a so-called MashApp. Software AG provides a sample Application Monitoring MashApp which shows and evaluates the data which is collected by the Application Monitoring Data Collector. It is a showcase how a KPI-specific visualization can be achieved with MashZone.
The Application Monitoring MashApp supports MashZone 2.3 and above.
The following topics are covered below:
The Application Monitoring MashApp and related data are provided in a zip file in Empower, as a download component for EntireX. To download the zip file, proceed as follows:
Log in to Empower (https://empower.softwareag.com/).
Go to Products & Documentation > Download Components > EntireX - Application Monitoring MashApp.
Download the "Application Monitoring MashApp" component (EXX_AppMon_MashApp.zip).
In addition to the zip file, Empower also provides a readme file (Readme_EXX_AppMon_MashApp.txt) which contains the latest update information.
You have to unpack the EXX_AppMon_MashApp.zip file to the following MashZone user data directory, depending on the MashZone version that you are using:
For MashZone 9.0 and above:
<installation-directory>\server\bin\work\work_mashzone_<t>\mashzone_data
<t> indicates the type of the MashZone server. Types are s, m, and l. For example, work_mashzone_m for a medium type.
For MashZone versions lower than 9.0:
<installation-directory>
where <installation-directory> is the MashZone installation directory.
After unpacking the zip file, the following directories are available in the MashZone user data directory:
| Directory | Content |
|---|---|
| importexport\ApplicationMonitoring_<date> | MashApp for application monitoring. |
| resources\ApplicationMonitoring\Definition | Resources used by the MashApp. Initially, this directory contains the resources which do not have to be edited. |
| resources\ApplicationMonitoring\Definition_src | Source directory for resources which have to be edited (further information is provided below) and copied into the resources\ApplicationMonitoring\Definition directory. |
| resources\ApplicationMonitoring\Data | Default application monitoring directory. This is the directory where the MashApp expects by default the application monitoring overview and data files. |
| assets\colorschemes | Color schemes. The color schemes for application monitoring are named AppMon_*.xml. |
To adapt the Application Monitoring MashApp to your requirements, you have to edit the resource files in the resources\ApplicationMonitoring\Definition_src directory as described below. The resource files are CSV files with commas (,) as separators. To edit them, any tool which is able to handle text files can be used.
The following resource files are provided:
Directory.csv
The Application Monitoring MashApp expects that the application
monitoring CSV files are available in any subdirectory of the
<MashZone-user-data>\resources\ApplicationMonitoring
directory. If the Application Monitoring Data Collector writes its data
directly into such a subdirectory, you can continuously monitor the incoming
data. If your application monitoring data has been written into any other
directory, you can manually copy the whole directory (including the
appmon.overview.v1.csv file) into a subdirectory of the
<MashZone-user-data>\resources\ApplicationMonitoring
directory and analyze the data with the MashApp. The MashApp refreshes every
minute so that it always displays the most recent data.
The Directory.csv file contains the relative names of the subdirectories containing the application monitoring data. If you use multiple directories, you have to specify one line for each directory.
The first line in the file is in general used as the default directory when you start the MashApp. Further directory entries can be selected on the Data Files tab of the MashApp. The delivered Directory.csv file contains one sample line for the Data directory. If you do not modify the Directory.csv file, all application monitoring data files are expected in the resources\ApplicationMonitoring\Data directory.
| Column | Description |
|---|---|
| Enable | An entry is only shown on the Data Files tab of the MashApp if "Enable" is set to "y". |
| Description | Specify a descriptive name for the directory. The descriptions are used in the data file selection of the MashApp. If the description is empty, the "Path" value is used as the description. |
| Path | Specify the path to the application monitoring directory. The path is always left-expanded with ./resources/ApplicationMonitoring/. The default path is Data which is expanded to ./resources/ApplicationMonitoring/Data. |
Properties.csv
This file contains settings for the Application Monitoring MashApp.
You can specify a value for each given property. If you do not modify the
Properties.csv file, the default property values are
used.
| Property | Description |
|---|---|
| Response Time yellow | The response time reflects the complete time
of the roundtrip from the client to the server and back. The lower the response
time, the better the overall application performance. Good, average or poor
performance is indicated in the MashApp by a green, yellow or red colored
background, respectively.
Specify the value of the yellow threshold (in units of milliseconds) for which the response time leaves the green zone. Default: 1000. |
| Response Time red | Specify the value of the red threshold (in units of milliseconds) for which the response time leaves the yellow zone. Default: 2000. |
To activate the Application Monitoring MashApp, make sure you have a Professional, Enterprise or Event license file, that you have administrator rights, and then proceed as follows:
Copy all resource files from resources\ApplicationMonitoring\Definition_src to resources\ApplicationMonitoring\Definition.
Invoke MashZone.
Go to the Administration page (see the corresponding link at the top of the page) and then to the Import/Export/Delete page.
Import the MashZone archive file (*.mzp) from the importexport\ApplicationMonitoring_<date> directory using the Import function.
The MashApp in the importexport\ApplicationMonitoring_<date> directory is named as follows:
M_Application Monitoring <version>_<revision>_<date>-<time>.mzp
The following configuration parameters of the Application Monitoring Data Collector (see Configuration for Application Monitoring) require special settings when data is to be evaluated by the Application Monitoring MashApp.
| Parameter | Special Configuration |
|---|---|
entirex.appmondc.directory |
If the MashApp is to continuously monitor the
application monitoring data, set this parameter to
<MashZone-user-data>/resources/ApplicationMonitoring/Data Alternatively, you can also use a different subdirectory of the resources/ApplicationMonitoring directory. In this case, you have to adjust the Directory.csv resource file accordingly. |
entirex.appmondc.maxlines |
MashZone Version 9.6 and above is able to process
a maximum of 100000 lines in a table. For previous versions, the maximum value
is 10000 lines.
By default, the MashApp concatenates seven CSV files. It is therefore recommended to restrict this parameter to 14000 for MashZone Version 9.6 and above, or to 1400 for previous versions. If you plan to concatenate less CSV files in general, you can use a higher value. |
entirex.appmondc.usezeroasnullvalue |
Set this parameter to yes to avoid
errors in the MashApp.
|
After you have specified all required information as described above, you can proceed as follows:
Invoke MashZone.
Open the MashApp "Application Monitoring".
Select the Overview tab.

The MashApp consists of several tabs offering various functions for monitoring and analyzing the application monitoring data. It also has one tab for data file selection, and one tab for the overview. The overview page shows a brief description of the tabs and charts available in the MashApp (see also the following table) and provides links to the corresponding functions.
| Tab Name | Function Name | Description |
|---|---|---|
| Response Time | Response Time Monitor | Provides history charts which show the general performance and system load consumed by your distributed application. |
| Transactions | Transaction Monitor | Provides history charts which show the general service usage. |
| Successful | Successful Transactions | Provides a response time analysis for successful transactions. |
| Error | Error Transactions | Provides a response time analysis for error transactions. |
| Average | Average Response Time | Provides a performance analysis for the components of your distributed application. |
| Total | Total Response Time | Provides an analysis of the system load consumed by the components of your distributed application. |
| Distribution | Distribution | Shows the distribution of the selected KPI (transactions, response times, database calls) over the instances of selected components (scenario, application, program, client host, client application, or client user). |
| High Values | High Values | Shows for each component the most used instances, maximum response times, and more. |
| Aggregation | Aggregation | Shows summarized information for all instances of the selected aggregation criterion. |
| Data Files | Data File Selection | Allows you to select the CSV data files that are to be evaluated by the MashApp. |
| Overview | Application Monitoring Overview | Gives an overview of the functions and charts of the MashApp, including links to the corresponding tabs. |
The following topics are covered below:
On most tabs, a common master view is shown at the top.
In general, the master view contains the following elements (from left to right, and from top to bottom):
The MashApp function (for example, "Transaction Monitor") and the currently selected time range.
Summarized data for the current function (for example, the number of transactions) according to the values that are currently selected in the master view.
A selection box for selecting the time range. The following predefined time ranges are available:
Last hour
Last 2 hours
Last 4 hours
Last 8 hours
Last day
Last 2 days
Last week
Last 2 weeks
Last month
Last quarter
Last year
All data in the selected files
Custom range
The Last ... time ranges always use the last entry in the selected data files as the basis. For example, if the last entry in the selected data files was written at 09:00, the Last hour refers to the time from 8:00 to 9:00.
The MashApp offers only those Last ... time ranges which are appropriate for the currently selected data files. For example, if the selected data files comprise 3 hours, the MashApp will not offer Last 4 hours or higher values.
The time range All data in the selected files refers to all data in the data files that are currently selected on the Data Files tab.
When you select Custom range, the titles for the selection boxes in the next two lines will change from Only Valid for Custom Range to Custom Range From and Custom Range To. You can then specify the desired start and end times (date, hour and minute) for the time range in these two lines. The custom range is not restricted to the data of the currently selected data files. It always reads from the start date until it reaches the end date, or until seven data files have been read (the MashApp is only able to evaluate up to seven data files).
A selection box for the time interval. The following predefined time intervals are available:
1 minute
5 minutes
10 minutes
15 minutes
30 minutes
1 hour
2 hours
4 hours
8 hours
1 day
1 week
The time interval is used when the data has to be aggregated on the time axis of a history chart. For example, if the time interval is 10 minutes, all data of a 10 minute time interval is aggregated into one value which is displayed in the history chart.
The MashApp offers only those time intervals which are appropriate for the currently selected time range and which will not end up with too many entries. For example, if the selected time range comprises 1 week, the MashApp will offer the aggregated time intervals from 2 hours to 1 day.
Selection boxes for the following components:
Scenario
Application in Data Collector
Server Program
Client Host
Client Application
Client User
The charts on the different tabs of the MashApp evaluate the data according to the selected components. By default, the MashApp evaluates all data for all components.
The MashApp only offers for selection the components which are available in the currently selected data files and in the currently selected time range. The component selection boxes are filled from top to bottom. The content of each selection box depends on the selection in the previous selection box.
Possible scenarios are:
RPC
CICS ECI
IMS Connect
The application names are defined in the EntireX broker attribute file. See Setting Up EntireX Broker.
Other selection boxes in the common master view, which have not been mentioned above, are function-specific and are described in the corresponding sections later in this documentation.
The Response Time tab shows the history of the response time according to the selected time range and components. The data is aggregated according to the selected aggregated time interval.
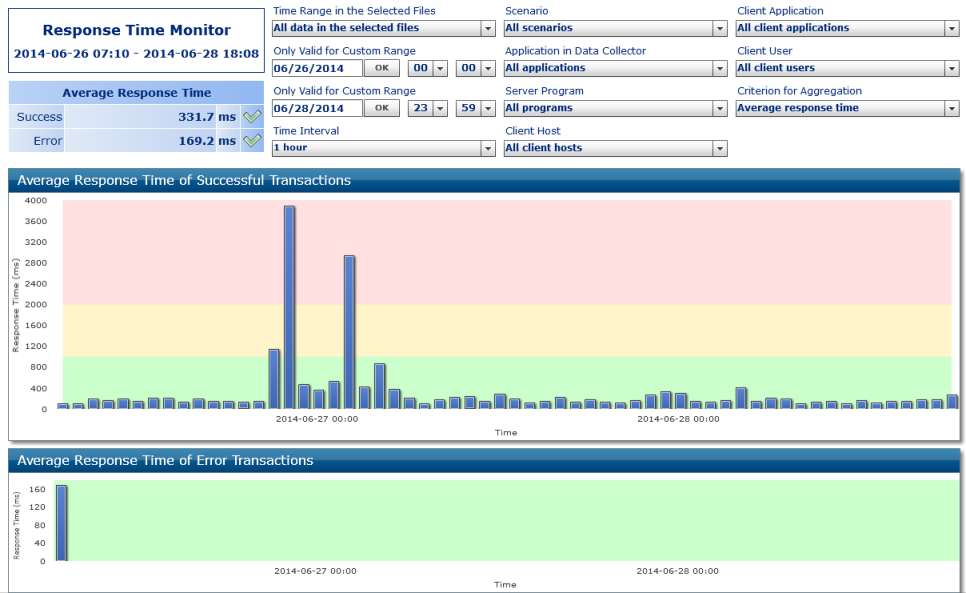
The upper chart shows the history of successful transactions; the lower chart shows the history of error transactions. You can select the following from the Criterion for Aggregation selection box:
Average response time
The average response time is an indicator for the performance of your
distributed application. The lower the average response time, the better the
performance. Good, average or poor performance is indicated by the colored
background according to the settings in the Properties.csv
file.
Maximum response time (default)
The maximum response time shows the response time peaks of your
distributed application for each aggregated time interval. The chart helps to
identify single transactions which perform poorly, regardless of how the
application has performed in average. Good, average or poor performance is
indicated by the colored background according to the settings in the
Properties.csv file.
Total response time
The total response time is an indicator for the system load consumed
by your distributed application. Even an application with a good performance
may have a high system load if it is called very often.
The summarized data at the top of the tab shows the average, maximum or total response time for the selected successful transactions and error transactions. For the average and maximum response times, icons indicate good, average or poor performance according to the settings in the Properties.csv file.
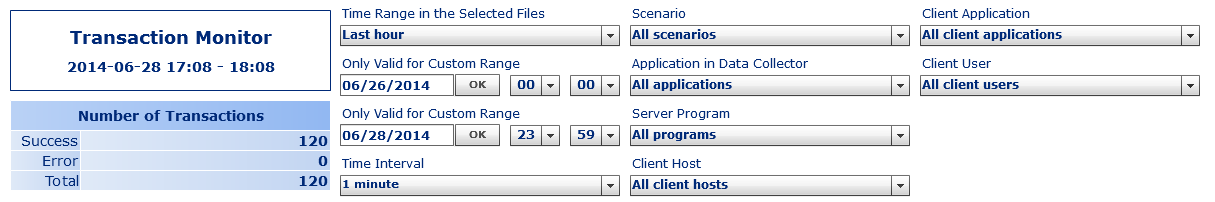
The Transactions tab shows the history of the number of transactions according to the selected time range and components. It is an indicator for the general service usage. The data is aggregated according to the selected aggregated time interval.
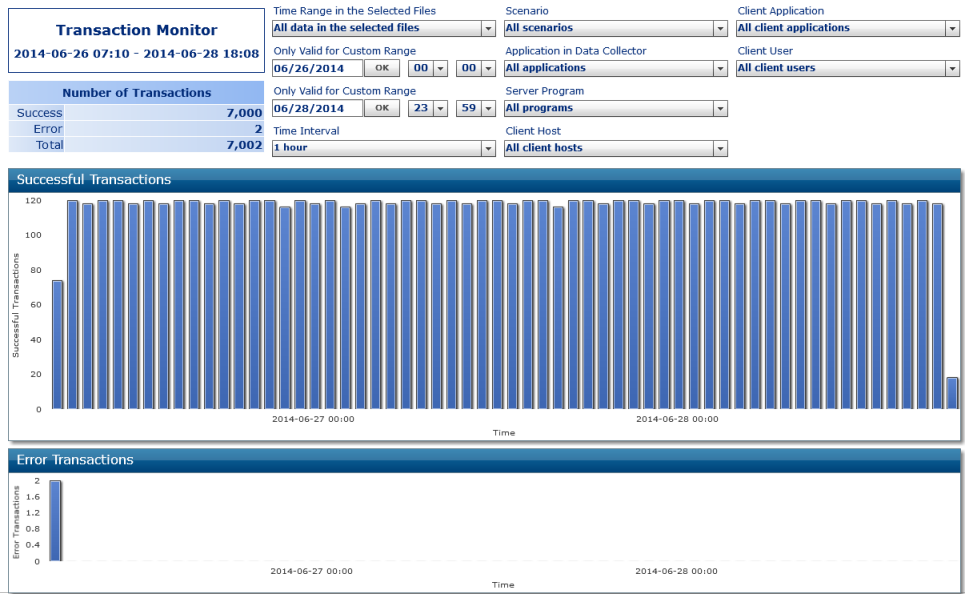
The upper chart shows the history of successful transactions; the lower chart shows the history of error transactions.
The summarized data at the top of the tab shows the total number of successful transactions and error transactions, and the total of both for the selected time range and components.
The Successful tab shows the successful transactions in the selected time range for the selected components.
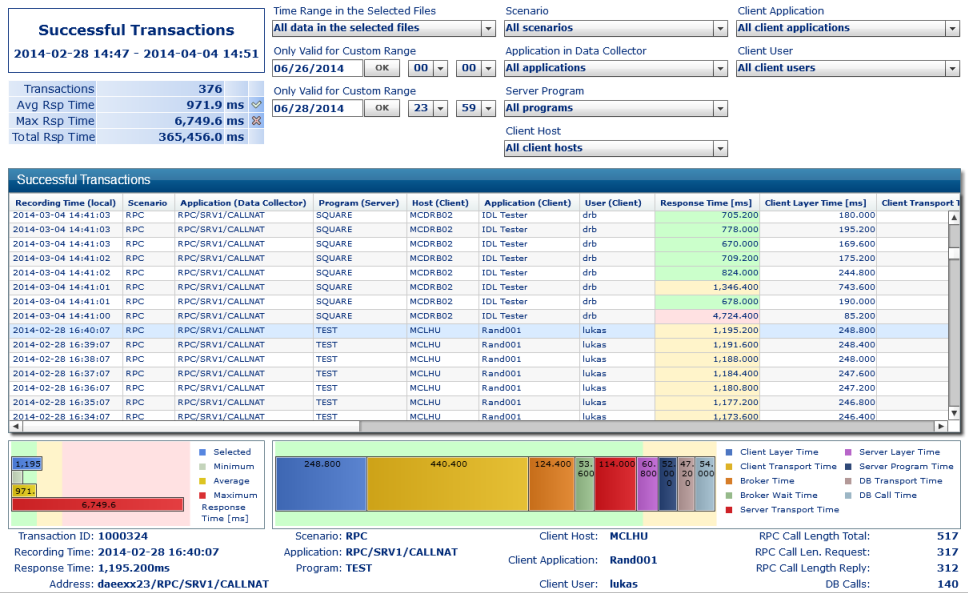
The table shows the application monitoring KPIs for each transaction. These are the KPIs for the successful requests as described in KPI Definitions for Application Monitoring.
In addition to the application monitoring KPIs, the table lists the Transaction ID which uniquely identifies each transaction. The transaction ID consists of the sequence number of the currently used data file in the appmon.overview.v1.csv file and (for the last six digits) the number of the record in the data file. By default, the transactions in the table are sorted by the transaction ID. You can change the sorting by clicking on the header of any column.
The Response Time column is colored according to the settings in the Properties.csv file, indicating good, average or poor performance.
When you select (click) a transaction, all available column values are shown at the bottom of the tab and the distribution of the measured times is visualized in the right bar chart below the transaction table. The left bar chart shows the response time of the currently selected transaction and compares it with the minimum, average and maximum response times of all transactions in the table. By default (if no transaction is selected), both charts show the average response time and the background is colored according to the settings in the Properties.csv file, indicating good, average or poor performance.
The summarized data at the top of the tab shows the number of successful transactions and the average, maximum and total response times for all successful transactions in the selected time range for the selected components. For the average and maximum response times, icons indicate good, average or poor performance according to the settings in the Properties.csv file.
The Error tab shows the error transactions in the selected time range for the selected components.
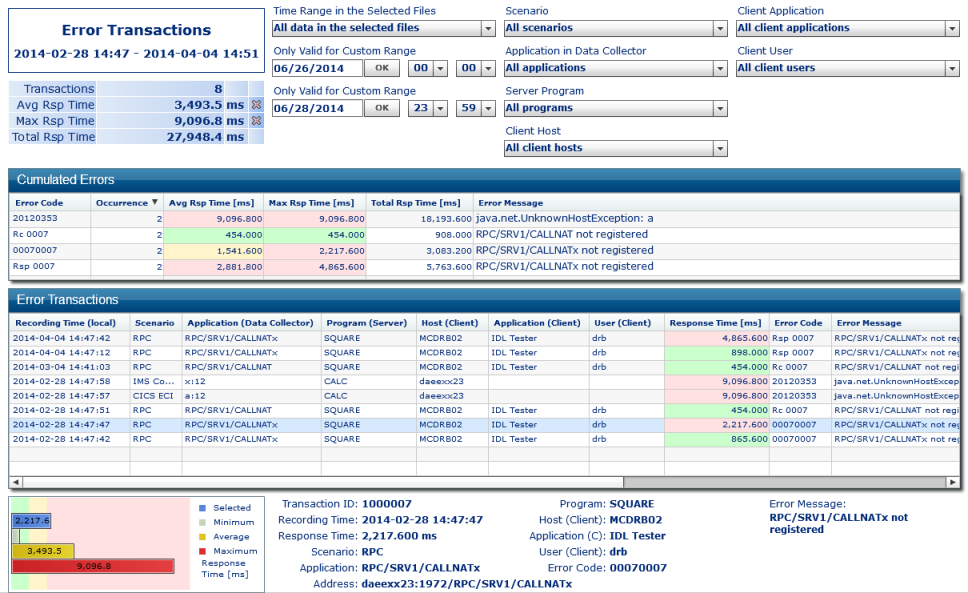
The upper table shows an overview of all error codes and messages. For each error code, you can see how often this error has occurred and its average, maximum and total response times. The columns for the average and maximum response times are colored according to the settings in the Properties.csv file, indicating good, average or poor performance.
The lower table shows the application monitoring KPIs for each transaction. These are the KPIs for the failed requests as described in KPI Definitions for Application Monitoring.
In addition to the application monitoring KPIs, the table lists the Transaction ID which uniquely identifies each transaction. The transaction ID consists of the sequence number of the currently used data file in the appmon.overview.v1.csv file and (for the last six digits) the number of the record in the data file. By default, the transactions in the table are sorted by the transaction ID. You can change the sorting by clicking on the header of any column.
The Response Time column is colored according to the settings in the Properties.csv file, indicating good, average or poor performance.
When you select (click) a line in the upper table, only the transactions with the selected error code and message are shown in the lower table.
When you select (click) a transaction in the lower table, all available column values are shown at the bottom of the tab. The bar chart below the table shows the response time of the currently selected transaction and compares it with the minimum, average and maximum response times of all transactions in the table. By default (if no transaction is selected), the chart shows the average response time and the background is colored according to the settings in the Properties.csv file, indicating good, average or poor performance.
The summarized data at the top of the tab shows the number of error transactions and the average, maximum and total response times for all error transactions in the selected time range for the selected components. For the average and maximum response times, icons indicate good, average or poor performance according to the settings in the Properties.csv file.
The Average tab shows the average response times of the selected successful transactions grouped by scenario, application, program, client application, client user or client host according to the setting of the Criterion for Grouping selection box. By default, all data is summarized into one group.
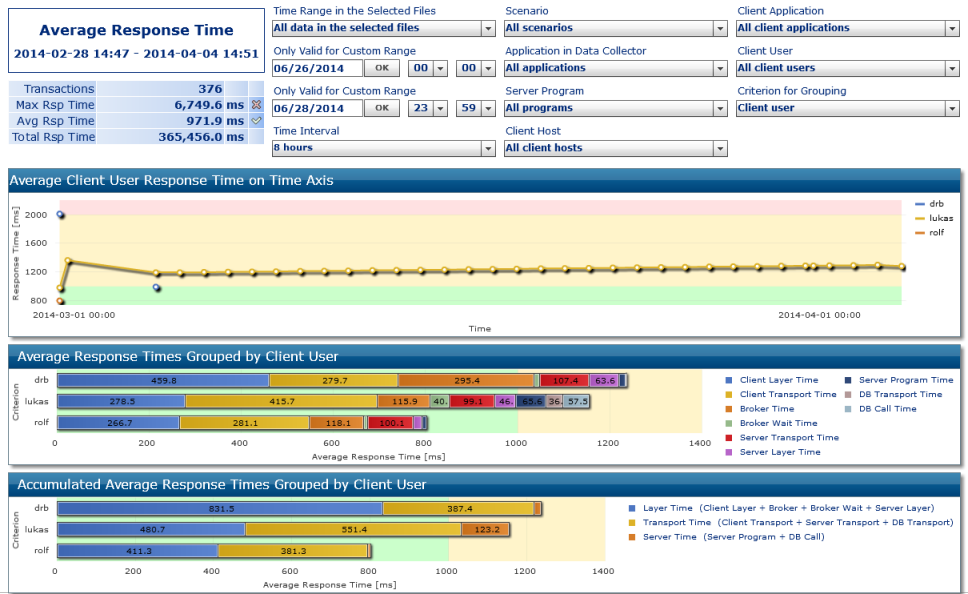
The average response time is an indicator for the performance of your distributed application. The lower the average response time, the better the performance. Good, average or poor performance is indicated by the colored background according to the settings in the Properties.csv file.
The line chart at the top shows the history of the average response time. There is one line for each instance of the selected grouping criterion. The data in the line chart is aggregated according to the selected aggregated time interval.
The bar chart in the middle shows the distribution of single measured times. There is one bar for each instance of the selected grouping criterion.
The bar chart at the bottom shows the measured times in three groups: layer time, transport time and server time. There is one bar for each instance of the selected grouping criterion.
By default, both bar charts show the average time of all selected transactions. When you click on a point in the line chart, the bar charts show only the response times of the corresponding point of time.
The summarized data at the top of the tab shows the number of successful transactions and the average, maximum and total response times for all successful transactions in the selected time range for the selected components. For the average and maximum response times, icons indicate good, average or poor performance, according to the settings in the Properties.csv file.
The Total tab shows the total response times of the selected successful transactions grouped by scenario, application, program, client application, client user or client host according to the setting of the Criterion for Grouping selection box. By default, all data is summarized into one group.
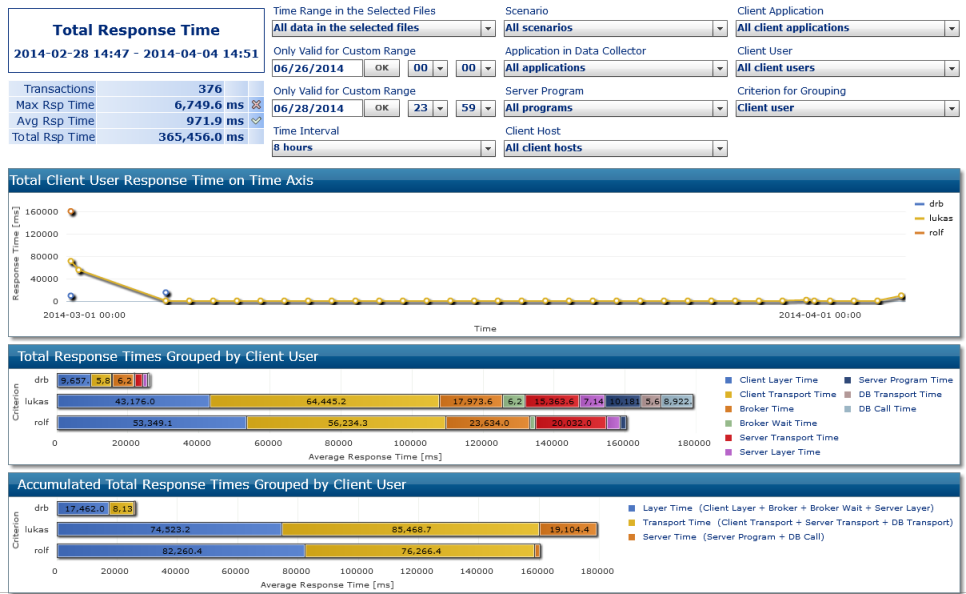
The total response time is an indicator for the system load consumed by your distributed application. Even an application with a good performance may have a high system load if it is called very often.
The line chart at the top shows the history of the total response time. There is one line for each instance of the selected grouping criterion. The data in the line chart is aggregated according to the selected aggregated time interval.
The bar chart in the middle shows the distribution of single measured times. There is one bar for each instance of the selected grouping criterion.
The bar chart at the bottom shows the measured times in three groups: layer time, transport time and server time. There is one bar for each instance of the selected grouping criterion.
By default, both bar charts show the total time of all selected transactions. When you click on a point in the line chart, the bar charts show only the response times of the corresponding point of time.
The summarized data at the top of the tab shows the number of successful transactions and the average, maximum and total response times for all successful transactions in the selected time range for the selected components. For the average and maximum response times, icons indicate good, average or poor performance, according to the settings in the Properties.csv file.
The Distribution tab shows four pie charts. Each pie chart displays the distribution of the selected KPI over the instances of a selected component. Only successful transactions are evaluated in this tab.
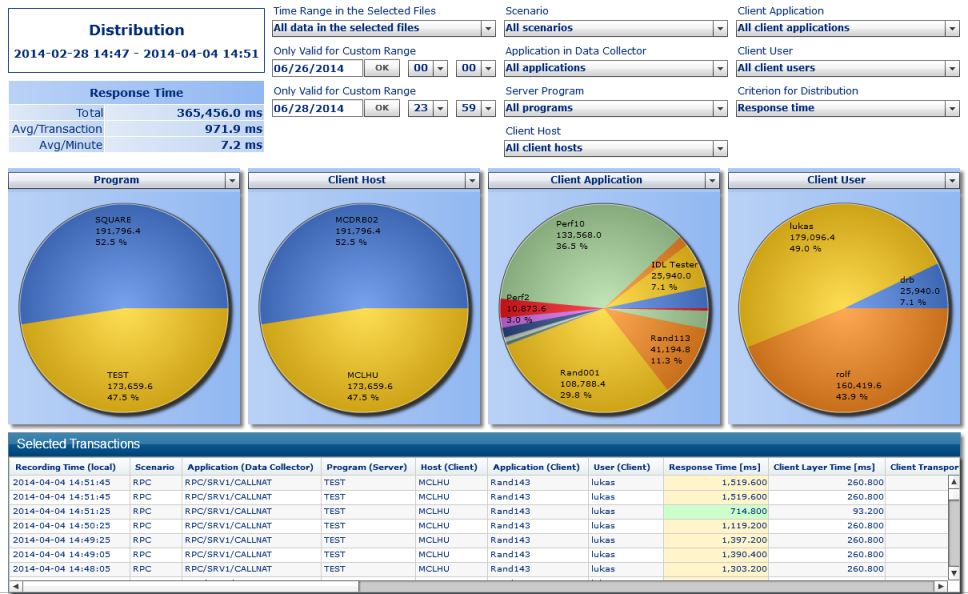
You can select the KPIs from the following areas from the Criterion for Distribution selection box:
Transactions
Response time
Layer time
Client layer time *
Broker time *
Broker wait time *
Server layer time *
Transport time
Client transport time *
Server transport time *
DB transport time *
Server time
Server program time *
DB call time *
DB calls
The layer, transport and server times are summaries of other KPIs. These KPIs are marked by an asterisk (*) in the above list. In the selection box of the MashApp, these KPIs are indicated by a leading ">".
Each pie chart shows the distribution for the component which is currently selected in the selection box directly above the pie chart. For each pie chart, you can select one of the following components:
Scenario
Application
Program
Client Host
Client Application
Client User
The selections in the master view at the top of the page can be used as pre-selections, for example, if only the values of a specific application or user are to be evaluated.
When you select (click) a section in a pie chart, the corresponding
component instance will be used as a filter for the subsequent pie charts. For
example, when you click the section for the SQUARE program (see
the above image), the other pie charts to the right will show only those client
hosts, client applications and client users which have called the
SQUARE program.
The table at the bottom lists the successful transactions filtered by the selections in the pie charts. The columns in the table are the same as in the Successful Transactions function.
The summarized data at the top of the tab shows the following values for the currently selected distribution KPI: the total, the average per transaction and the average per minute.
The High Values tab shows for each component the number of component instances, the name of the most-used instance and the percentage of the transactions referring the most-used instance.
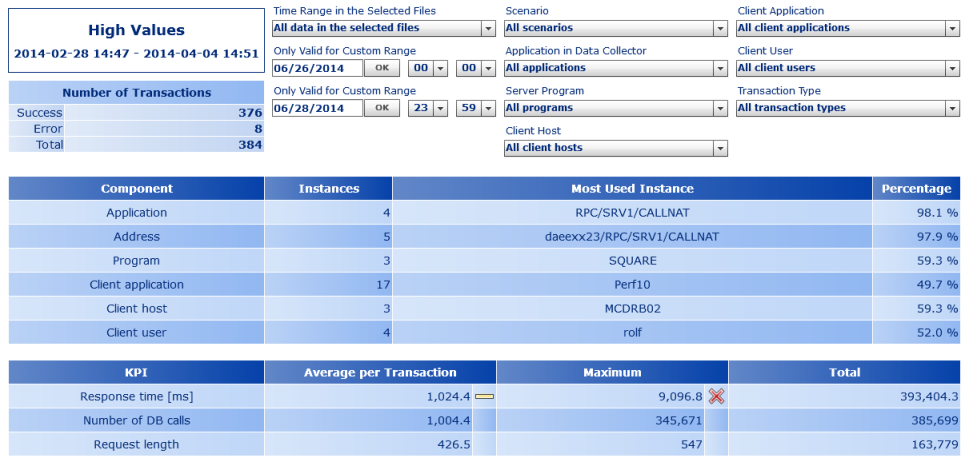
The following information is shown for some KPIs: the average value per transaction, the maximum value and the total. Note that database calls are only counted for calls against a Natural RPC server on a mainframe, whereas the Average per Transaction refers to all transactions.
If desired, the values can be restricted to successful transactions or error transactions only. By default, all transaction types are evaluated.
The summarized data at the top of the tab shows the total number of successful transactions and error transactions and the total of both for the selected time range and components.
The Aggregation tab shows summarized information for all instances of the selected aggregation criterion.
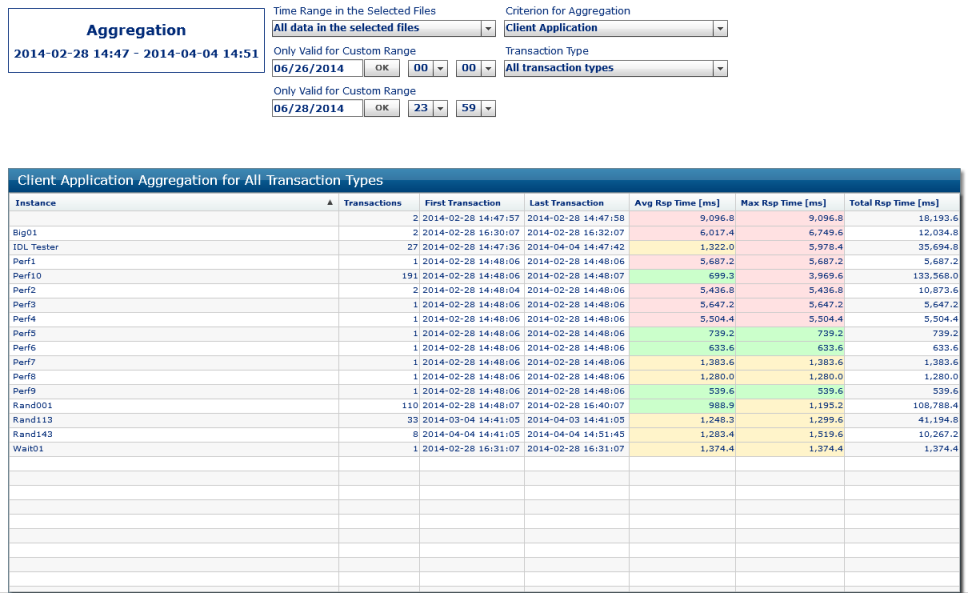
You can select one of the following aggregation criteria from the Criterion for Aggregation selection box:
Scenario
Application
Program
Client Host
Client Application
Client User
By default, all data is summarized.
The table lists all instances of the selected aggregation criterion. The following information is shown for each instance: the number of transactions, the date of the first and last transaction referring the instance, and the average, maximum and total response times. By default, the table shows the values for all transaction types. This can be restricted to successful or error transactions only.
The Avg Response Time and Max Response Time columns are colored according to the settings in the Properties.csv file, indicating good, average or poor performance.
The above image shows an example of a client application aggregation. The table lists all client applications which have been monitored in the selected time range.
The Data Files tab shows the currently selected data files.
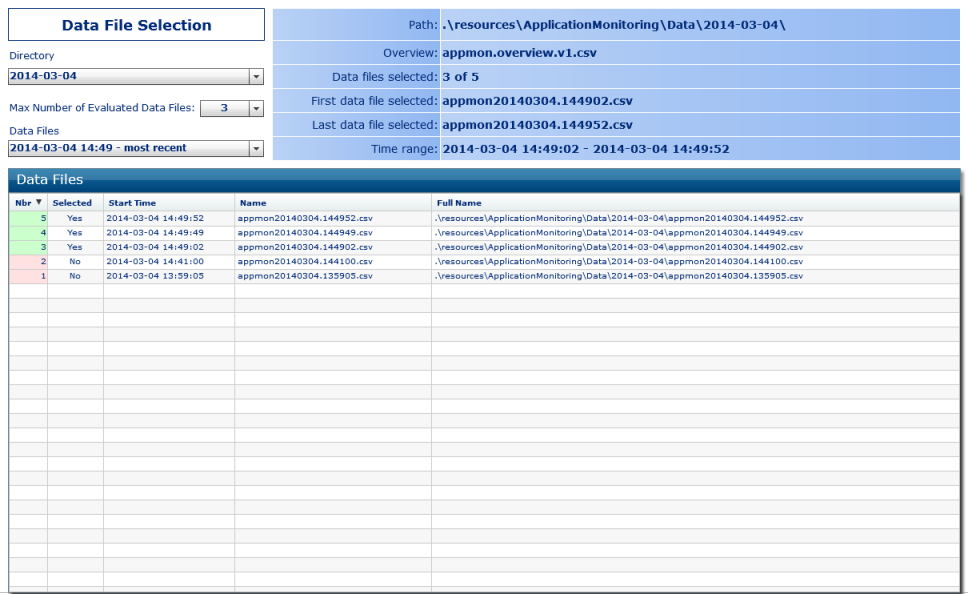
You can select the directory containing the data files according to the entries in the Directory.csv file, the number of subsequent data files (at most seven data files) and the data files that are to be evaluated.
The Data File(s) selection box shows as time range the start date of the first selected data file and the start date of the file which comes after the last selected data file. If the last selected file is the last file in the appmon.overview.v1.csv file, "most recent" is shown as the end date of the time range.
The table lists all data files of the selected directory according to the entries in the appmon.overview.v1.csv file. It shows the start time (when the first data was written to the data file), the name and the path (full name) to the data file. In addition, it indicates whether a data file is currently selected or not. This is also visualized by the color of the Nbr column.
All evaluations of the MashApp are restricted to the data of the currently selected directory. The values selected from Max. Number of Evaluated Data Files and Data File(s) are used when a Last ... time range is selected on another tab of the MashApp.
The data at the top of the tab shows the path to the currently selected directory, the name of the overview file, how many data files are currently selected from all available data files, the names of the first and last selected data files, and the time range that is used by the selected data files.
The Overview tab provides a short description of the functions, charts and selections of the Application Monitoring MashApp.
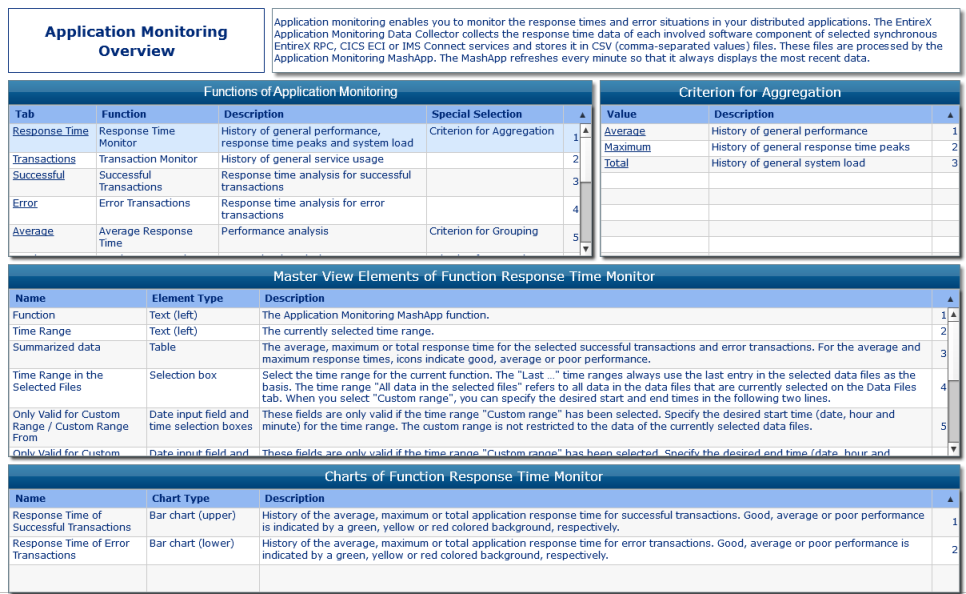
When you click an entry in the Tab or Value column, the corresponding page of the MashApp is shown with all selections set to their initial default values (including the data file selection).