This document covers the following topics:
Optimize enables you to monitor all Software AG component resources in real time. The Optimize solution for infrastructure monitoring makes use of the following components: Infrastructure Data Collector, Web Service Data Collector, and Optimize.
The Infrastructure Data Collector monitors the system and operational data associated with Software AG runtime components (such as Integration Servers, Broker Servers, Brokers, adapters, Adabas, ApplinX, Natural, Com-plete, EntireX as well as associated Adabas and Natural subproducts) and reports the status of these components with Optimize for Infrastructure. You use Optimize for Infrastructure to monitor the status of individual managed objects as well as the overall status of your system.
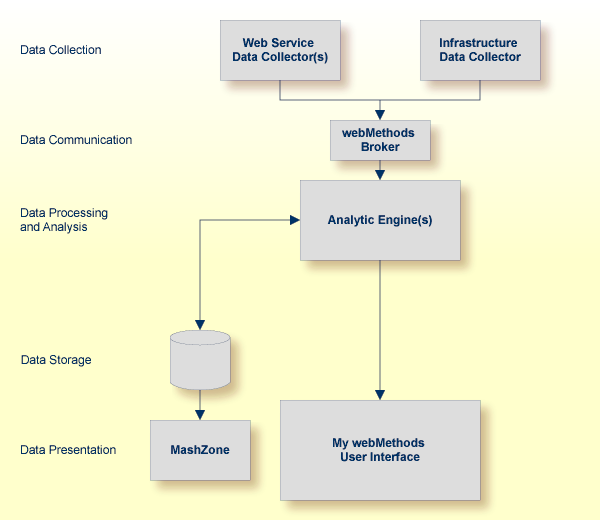
Optimize implementations perform the following main functions:
data collection
data communication
data processing and analysis
data storage
data presentation
Each subcomponent can reside on its own separate host, or all subcomponents can reside on the same host.
The existing Optimize product was extended for monitoring Software AG's enterprise products. In Optimize, no special handling is required for the enterprise products: the installation is done with the Optimize installation and you can use the My webMethods user interface or MashZone as the presentation layer.
A typical Optimize implementation for monitoring the infrastructure data of Software AG's enterprise products using the Infrastructure Data Collector is shown in the graphic below.
Optimize also includes a Web Service Data Collector which can be used to display data in the form of custom KPIs. A Natural API is provided for simple usage of this Web Service Data Collector from Natural applications.
With infrastructure monitoring, Software AG's enterprise products such as Adabas, ApplinX, EntireX or Natural are polled for infrastructure monitoring data. The Infrastructure Data Collector initiates the polling in regular intervals and receives the monitoring data which is then stored in the data storage. You can find out, for example, the number of calls to a database in the interval, the number of calls to EntireX Broker in the interval, the number of logons denied in Natural Security, and many more. Diagrams showing the values of the KPIs (key performance indicators) over time are visualized in the My webMethods user interface.
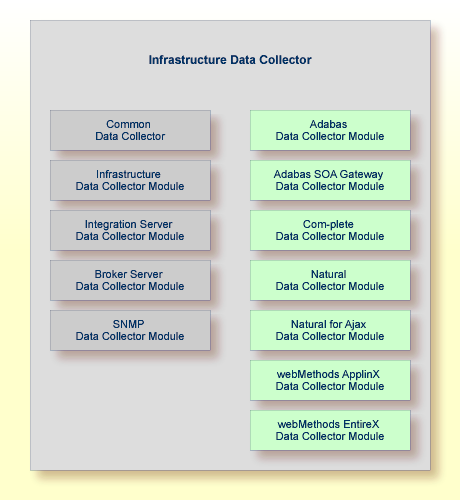
The Infrastructure Data Collector contains the following additional packages which, if enabled, allow the collection of data from Software AG's enterprise products:
AdabasDC
SOAGatewayDC
ApplinXDC
CompleteDC
EntireXDC
NaturalDC
NaturalAjaxDC
The available packages are illustrated in the graphic below.
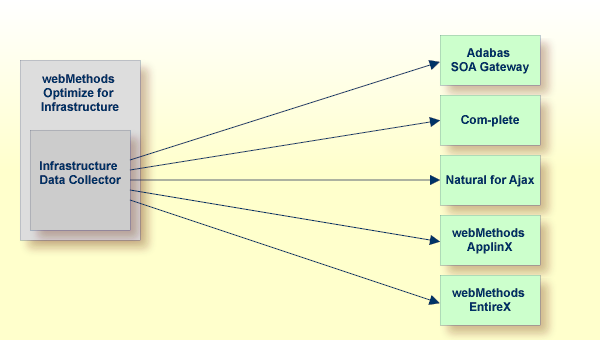
For monitoring Software AG's enterprise products and components, specific environments have to be set up. In principle, there are two types of environments:
Some products (Adabas SOA Gateway, Com-plete, Natural for Ajax, webMethods ApplinX and webMethods EntireX) can be monitored directly. Besides Optimize for Infrastructure and the monitored product, no further infrastructure is necessary.
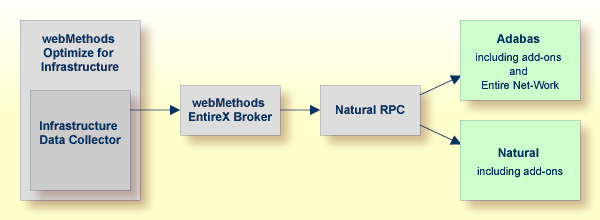
Other products (Adabas, Natural and Entire Net-Work) are monitored using a Natural RPC server. In addition to Optimize for Infrastructure and the monitored product, Natural, an EntireX Broker and Broker stubs have to be available.
One or more Natural RPC servers have to be set up for the diverse environments to be monitored. The products and components that can be monitored depend on the RPC server type. For example, a batch server monitors all global Natural components; a CICS server monitors in general only local environment-specific Natural components.
For further information, see Setting Up Infrastructure Monitoring.
The Software AG enterprise products listed below can be monitored if they are installed in your environment.
Adabas
Adabas Caching Facility
Adabas Delta Save
Adabas Event Replicator
Adabas Fastpath
Adabas Review
Adabas SAF Security
Adabas SOA Gateway
Adabas Transaction Manager
Com-plete
Entire Net-Work
Entire Operations
Entire Output Management
Entire System Server
Natural 1
Natural Advanced Facilities
Natural Connection 2
Natural Development Server
Natural for Ajax
Natural for DB2 2
Natural for VSAM 2
Natural Review
Natural RPC 2
Natural SAF Security
Natural Security
Natural SQL Gateway 2
Natural Web I/O Interface (server)
webMethods ApplinX
webMethods EntireX
zIIP Enabler for Natural 2
1 Some Natural components such as Natural for Adabas require the Natural Optimize Monitor Buffer Pool for the monitoring.
2 This product requires the Natural Optimize Monitor Buffer Pool for the monitoring.
Adabas
Adabas SOA Gateway
Entire Operations (UNIX only)
Entire Output Management (UNIX only)
Natural
Natural for Ajax
Natural Security
webMethods ApplinX
webMethods EntireX
Optimize will not replace any of Software AG's existing monitoring tools. All monitoring components in the different products have special assignments and will be developed further, in parallel to Optimize.
Special monitors such as Review will not be replaced by Optimize. In the future, they will be enhanced in such a way that they deliver data to Optimize. Review Natural Monitor has already been adapted and will deliver additional value to Optimize, if available.