Realm Connections
When a Universal Messaging client connects to a Realm Server, the server maintains information on the connection (see
Connection Information) that is available through the Universal Messaging Administration API. The API also provides mechanisms for receiving notification when connections are added and deleted (see the code example "Connection Watch" for an illustration of using this in the Administration API).
The Universal Messaging Enterprise Manager allows you to view the connections on a realm as well as drilldown and view specific information about each connection, such as the last event sent or received, and the rate of events sent and received from each connection.
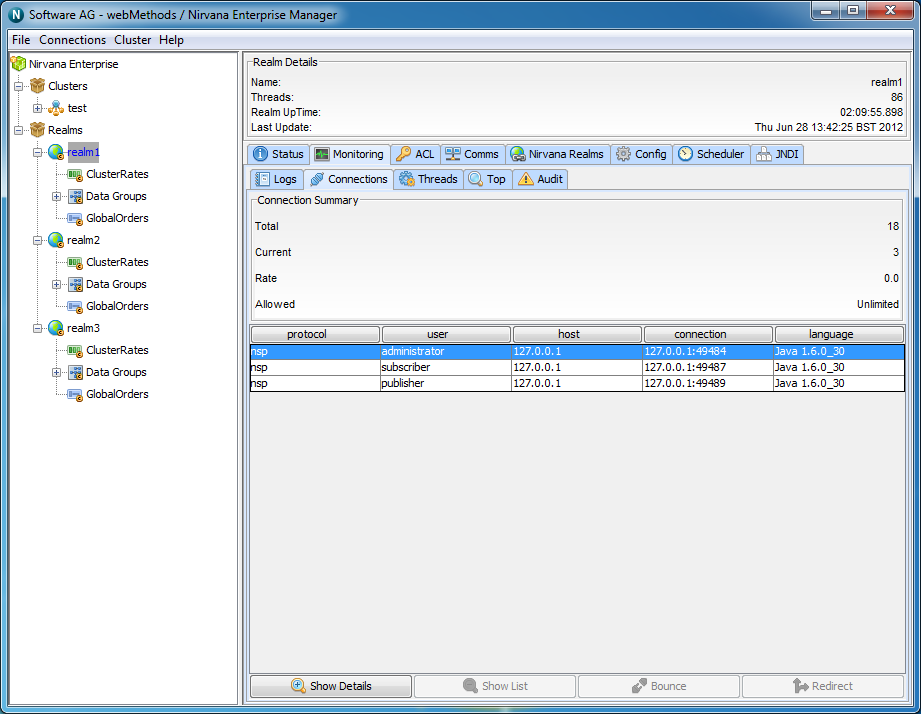
To view the current realm connections, simply select a realm node from the namespace, and select the 'Connections' tab from within the 'Monitoring' tab of the selected realm node. This will display a panel containing a table of connections, as shown in the image below.
The connections table has 4 columns:
 Protocol
 - The protocol used in the connection
User - The name of the user connected
Host - The host machine that the user is connecting from
Connection - The local connection id, defined as hostname:local_port
The highlighted connection above shows that the user has connection using the nhp protocol, to localhost. In this example, the nhp interface is running on port 80, so the RNAME of this connection was nhp://localhost:80/
When a connection is highlighted, there a number of things that can be shown for a the connection.
Firstly, connections can be disconnected by clicking on the 'Disconnect' button.
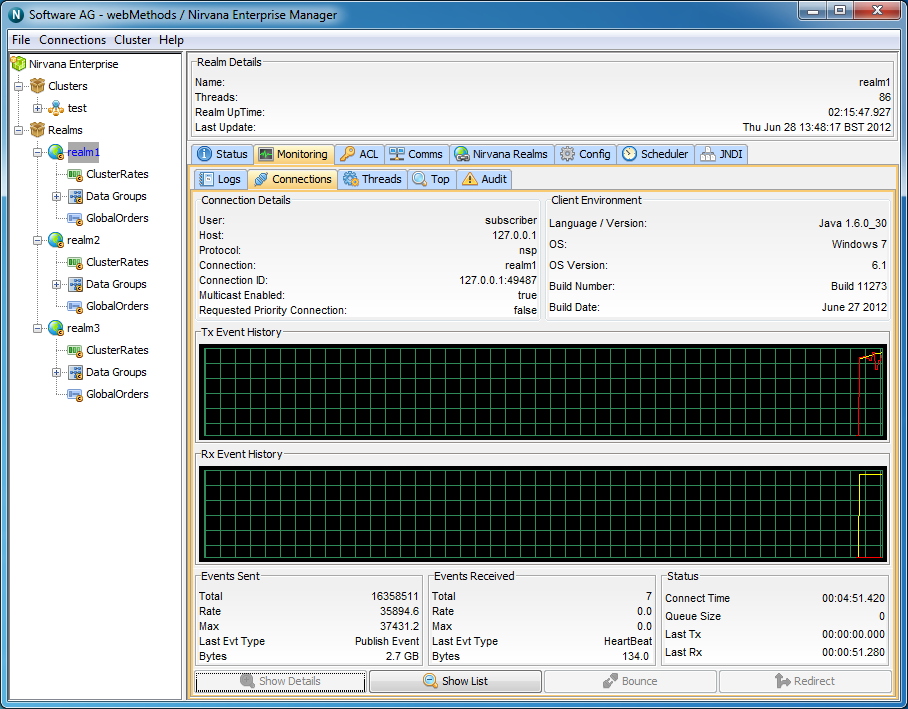
Secondly, by double-clicking on a connection from the table, or by clicking on the 'Show Details' button, you are presented with a panel that contains a more detailed look at the activity for the selected connection. The connection details panel is shown in the image below.
Connection Details
You will see that there are 2 separate information panels above the graphs once you have drilled down into a connection. The first of which is labelled Connection Details. This information contains information about the user connection, such as user name, host protocol.
Client Environment
Next to this you will see a panel that shows details regarding the client environment for this user. These includes API language / Platform, Host OS and Universal Messaging build number
The two graphs, labeled 'Tx Event History' and 'Rx Event History' show the total (yellow) and rates (red) for events received from the server (TX) and sent to the server (RX) for the selected connection.
The bottom of the connection details panel shows 3 sections of information for the selected connection, 'Events Sent', 'Events Received' and 'Status'. Each of these are described below.
Events Sent
The Events Sent section contains the values:
Total - The total number of events sent by the realm server to this connection
Rate - The rate at which events are being sent by the realm server to this connection
Max - The maximum rate at which events have been sent by the realm server to this connection
Last Event Type - The type of the last event sent from the realm server
Bytes - Total bytes sent by the realm server to this connection
Events Received
The Events Received section contains the following values:
Total - The total number of events sent by this connection to the realm server
Rate - The rate at which events are being sent by connection to the realm server
Max - The maximum rate at which events have been sent by this connection to the realm server
Last Event Type - The type of the last event sent from the connection to the realm server
Bytes - Total bytes sent by this connection to the realm server
Status
The Events Sent section contains the following values:
Connect Time - The amount of time this connection has been connected to the realm server
Queue Size - The number of events in the outbound queue of this connection (i.e. events waiting to be sent to the realm server)
Last Tx - The time since the last event was received by this connection from the realm server
Last Rx - The time since the last event was sent to the server from this connection
Clicking on the 'Show List' button will take you back to the connections table.