This document covers the following topics:
Application monitoring adds new value to monitoring. It enables you to monitor the response times in your distributed applications, and it also enables you to monitor a couple of error situations.
The EntireX Application Monitoring Data Collector collects the response time data of each involved software component of selected synchronous EntireX RPC services. The Application Monitoring Data Collector stores the KPI (key performance indicator) values in CSV (comma-separated values) files. The files can be processed by any tool which supports CSV files. A sample MashApp is also provided.
When a service has been selected for monitoring, each call to the service by a client application is monitored. The overall service response times, the network transport times, the EntireX Broker processing and waiting times, the RPC (remote procedure call) server processing times, and the time spent for database calls are measured. Each involved Software AG enterprise product concatenates the monitored time(s) with the service call. When the call returns to the client, the client RPC runtime provides the event data to the Application Monitoring Data Collector.
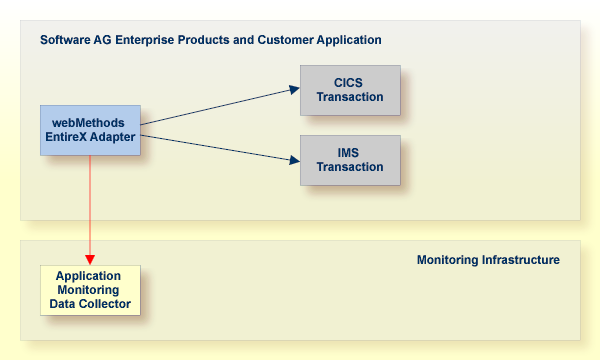
In addition to monitoring RPC scenarios as described above, you can also monitor scenarios where the EntireX Adapter is used to call transactions using CICS ECI or IMS Connect.
The collection of response times and other measuring data from your distributed application in real time requires that you set up various components for application monitoring. See Setting Up Application Monitoring for detailed information.
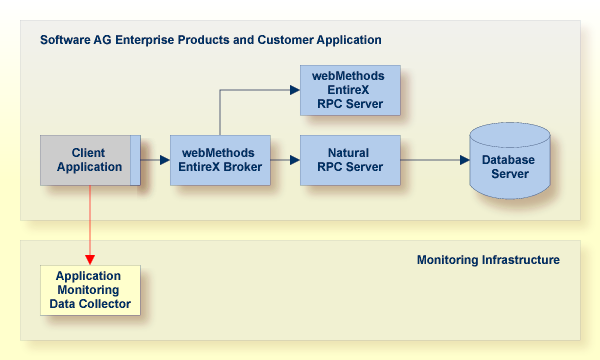
The following graphics illustrate examples of different scenarios in which application monitoring can be used. The boxes in the graphics contain the components that are running in your production environment. The components in the blue boxes can be monitored. The components in the gray boxes cannot be monitored. The yellow box represents the Application Monitoring Data Collector which is required for collecting data and for measuring the response times. The black lines stand for calls from the application. The red line stands for the measuring data which are being transported.
Note:
See also Components Which
Support Application Monitoring.
The small blue box linked to the gray "Client Application" box represents the client RPC layer which can be monitored, whereas the client application itself cannot be monitored. Note that the time spent for database calls can only be monitored if the call is issued by a Natural RPC server.
Note:
In the above scenario, the Direct RPC component of the EntireX
Adapter can be used instead of the EntireX Broker.
The time spent in the CICS or IMS transaction cannot be monitored. Only the sum of the transport time to CICS ECI or IMS Connect plus the time spent in the CICS or IMS transaction can be monitored.
The following graphic shows the detailed meanings of the response time KPIs that are collected by the Application Monitoring Data Collector. As an example, a remote procedure call (RPC) from a client application to a server program is illustrated. For a Natural server program, database calls can be monitored; this is illustrated on the left side of the graphic. Note that the database transport time (TimeDBTransport KPI) is only available for a database call against an Adabas server. For other databases, the database transport time is included in the database calls time (TimeDBCalls KPI). The right side illustrates a non-Natural server program where database calls cannot be monitored.
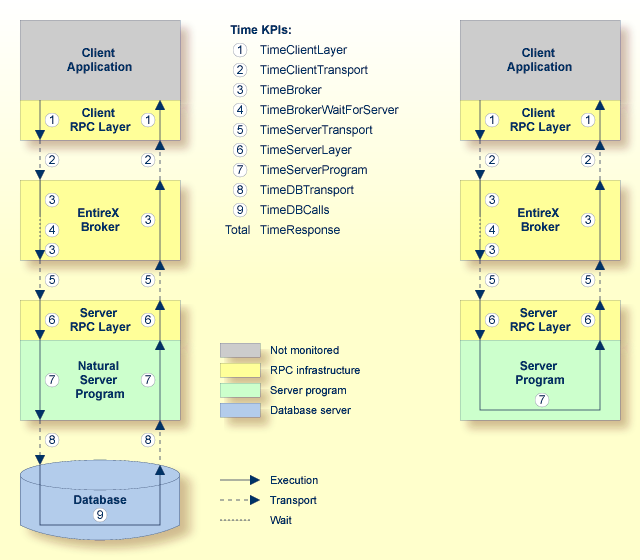
The client application issues a remote procedure call and the client RPC layer gets control. At the end of a transaction, the client RPC layer gives the control back to the client application. The time spent in the client RPC layer is monitored by the TimeClientLayer KPI.
The client RPC layer calls the EntireX Broker. The transport time between the client RPC layer and the EntireX Broker plus the transport time spent on the way back is monitored by the TimeClientTransport KPI.
The time spent in the EntireX Broker is monitored by the TimeBroker KPI. The KPI value does not include the amount of time that the EntireX Broker spends waiting for an available server.
The amount of time that the EntireX Broker spends waiting for an available server is monitored by the TimeBrokerWaitForServer KPI.
When the EntireX Broker calls the server program, the server RPC layer receives the call first. The transport time between the EntireX Broker and the server RPC layer plus the transport time spent on the way back is monitored by the TimeServerTransport KPI.
The time spent in the server RPC layer is monitored by the TimeServerLayer KPI.
The server RPC layer forwards control to the Natural server program. The time spent in the Natural server program is monitored by the TimeServerProgram KPI. The KPI value does not include the time spent for database calls.
The Natural server program calls a database. The transport time between the Natural server program and the database plus the transport time spent on the way back is monitored by the TimeDBTransport KPI. This KPI is only available for Natural RPC servers issuing database calls against an Adabas server.
The time spent for database calls is monitored by the TimeDBCalls KPI. For non-Adabas databases, the KPI value includes also the transport time required to reach the database server. This KPI is only available for Natural RPC servers.
The TimeResponse KPI reflects the complete response time on the round trip from the client to the server. It is therefore the sum of the KPIs mentioned above.
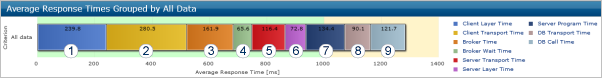
Using the sample Application Monitoring MashApp, the total response time is represented in a bar chart in which each single time KPI is reflected in a section of the bar. In the following example, the time KPIs are labeled with the same numbers as in the above graphic. At a glance, you can find out how much response time was spent for each part of the distributed application.