This document covers the following topics:
Broker traces, as well as traces produced from applications communicating with the Broker (so-called "stub traces"), contain a lot of details of the particular Broker calls. However, their layout is different and not easy to understand. The EntireX Trace Utility reads these Broker kernel as well as stub traces and produces a file with a common layout, where one line corresponds to a Broker call. The file layout is a standard CSV file (comma-separated values).
The request (Broker call sent from the stub to the kernel) and the corresponding reply (response sent back from the kernel to the stub) are merged together and presented as one logical Broker call in one row of the output file. Line numbers in the trace file and times for the request and reply are provided. It is also possible to specify filters so only the specified subset of the Broker calls are extracted. Since the Broker trace file contains all activities from both clients and servers and since it is possible to filter the calls, an end-to-end analysis of a conversation is simple to analyze.
The EntireX Trace Utility is divided into two separate elements: Process Trace and Show Trace.
Process Trace is used to process the information contained in the Broker trace file, saving the requested output to a simple text file.
 To open the EntireX Trace Utility under UNIX
Run the script traceutility.bsh located
under /opt/softwareag/EntireX/bin.
To process the trace information
Follow the instructions on the following screens.
The following window is displayed.
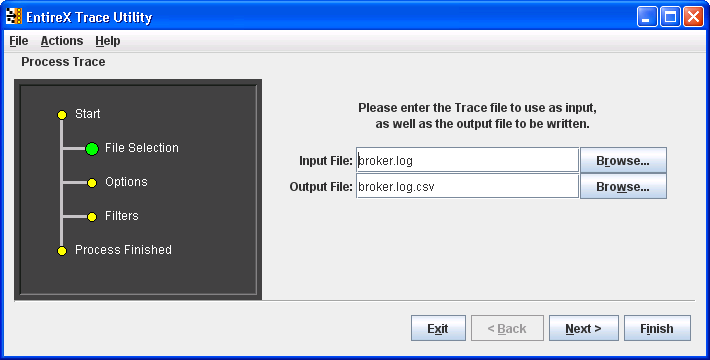
The dark gray display section - the wizard window - shows you which step is required. File Selection has a large green dot, so the input and output files are required.
In the display section Options is green.
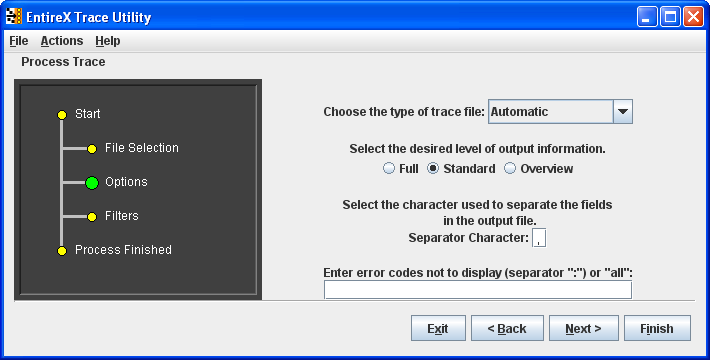
See Output Field Options for information on Full, Standard and Overview.
See Options under Using the EntireX Trace Utility in Batch Mode for information on type of trace file and error codes not to display.
The defaults of Process Trace are:
use automatic detection of trace file type
return the standard amount of output
save the output fields separated with commas (as this format is needed to be able to view the output in Show Trace)
display all errors found in the trace file.
The default separator character is ",", you can change this character.
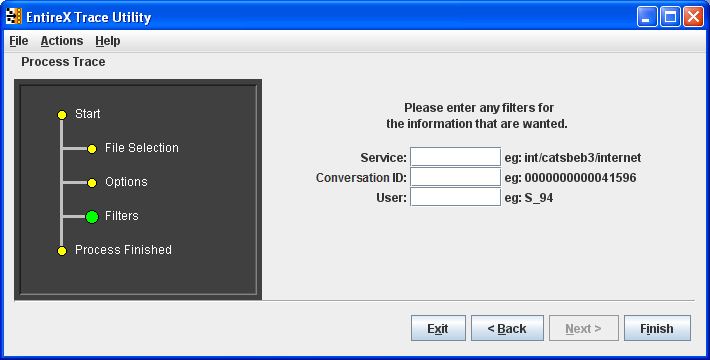
For the Standard and Full output options you can set filters to reduce the amount of information written to the output file, to create a more focused collection of information.
You can set filters for the Conversation ID (for example: 000000000041596), the Broker service (for example: int/catsbeb3/internet) and the User (for example: S_94).
The User filter does not correspond to the User ID or Physical User ID from the trace, but a generated value from Process Trace. This filter can only be used after already analyzing an output file and deciding which User to filter for.
If more than one filter is specified only those entries which satisfy all conditions will be displayed.
To generate the output file
Choose Finish.
At this point any errors from processing the trace file are shown.
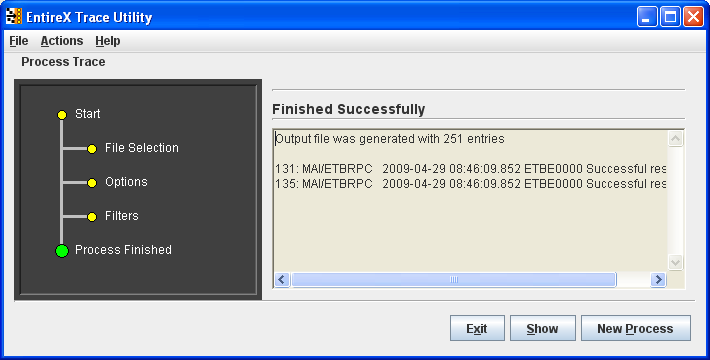
To display the results from the processing
Choose Show.
To leave the program
Choose Exit.
To process another trace file
Choose Process Trace from the menu bar.
A new processing wizard is started.
You may select between three levels of output to be written to the output file:
| Option | Output Fields |
|---|---|
|
Overview |
Phys Userid, Userid, Token, User, Service |
|
Standard |
Thread, Req, Reply, Phys Userid, Userid, Token, User, Function, Error, Service, Convid, Uowid, Uowstatus, Slen, Retl, Cuid |
|
Full |
Thread, Req, Reply, Phys Userid, Userid, Token, User, Function, Error, Service, Convid, Uowid, Uowstatus, Slen, Retl, Cuid, Time1, Time2, Api, Rlen, Cstat, Charset, SecurityToken, Security, TimeDiff, ReplyTime, Seqid, AppName, Node, Stub, Library, Program, Brokerid |
Description of the columns in the CSV file (comma-separated values).
Note:
Output which is the result of stub trace files does not contain
entries for all columns.
| Column | Explanation | ||||||||||||||
|---|---|---|---|---|---|---|---|---|---|---|---|---|---|---|---|
| Thread | The name of the Java thread executing the Broker call. Only available for trace files produces by the EntireX Java runtime. | ||||||||||||||
| Req | The line number in the trace file where the request part of the Broker call starts. 0 if the request cannot be found in the trace file. | ||||||||||||||
| Reply | The line number in the trace file where the reply part of the Broker call starts. 0 if the reply cannot be found in the trace file. | ||||||||||||||
| Phys.User ID | The physical user ID (Unique ID) which is displayed as a binary value in the Broker trace, nicely formatted. In case of a C stub trace file, the real physical user ID is not available; instead of this the thread ID is used to construct a replacement for the physical user ID. | ||||||||||||||
| User ID | The user ID of the Broker call. | ||||||||||||||
| Token | The token of the Broker call. | ||||||||||||||
| User | An artificial identifier for a user session (using physical user ID, user ID, and token). This is a unique number prefixed with either C- or S- . The latter will be used if the caller can be identified (using the available data in the trace) as a server application. | ||||||||||||||
| Function | The Broker function. If an option is specified it is appended to the function name. If a wait timeout is specified for the send or receive function it is appended. | ||||||||||||||
| Error | Error class, error number and error text. Error 0000 0000 is not displayed. The text "Successful response" is not displayed. | ||||||||||||||
| Service | The service address in the form class/server/service. | ||||||||||||||
| Convid | The conversation ID prefixed with *. If the conversation ID in the reply is different from the one in the request, the one from the reply is used. | ||||||||||||||
| Uowid | The unit of work ID prefixed with *. If the unit of work ID in the reply is different from the one in the request, the one from the reply is used. | ||||||||||||||
| Uowstatus | The unit of work status | ||||||||||||||
| Slen | The send length, i.e. the length of the data sent to the Broker. | ||||||||||||||
| Retl | The return length, i.e. the length of the data returned from the application. | ||||||||||||||
| Cuid | The client user ID (only for servers). | ||||||||||||||
| Time1 | The time of the request entry in the trace file. | ||||||||||||||
| Time2 | The time of the reply entry in the trace file. | ||||||||||||||
| Api | The API version. | ||||||||||||||
| Rlen | The (maximum) receive length specified in the send/receive call. | ||||||||||||||
| Cstat | The conversation status (only for servers). | ||||||||||||||
| Charset | The character used by the caller. Typical values are ascii, ebcdic siemens. If a value for the locale string has been specified, it is added using / as a separator. | ||||||||||||||
| SecurityToken |
|
||||||||||||||
| Security | Some security-relevant control block fields of the call. If Forcelogon is enabled "fl:" is displayed. If encryption level has been specified either "broker" or "target" is displayed. If a password has been specified an artificial password is displayed. If in addition a new password has been specified, it is added using / as a separator. The artificial password is displayed as "pwd" followed by a number (starting with 0). | ||||||||||||||
| TimeDiff | The elapsed time between the request and the reply (Time2 - Time1). | ||||||||||||||
| ReplyTime | Server response time (difference in time between the server receiving a request and sending the reply). | ||||||||||||||
| Seqid | The internal sequence ID of the Broker call. Only available for Broker version 7.3 or higher. | ||||||||||||||
| AppName | Name of the application communicating with the Broker. Only available if API version 9 or greater is used. | ||||||||||||||
| Node | Node name of the application which is communicating with the Broker, e.g. the TCP/IP hostname. Only available if API version 9 or greater is used. | ||||||||||||||
| Stub | Stub name and version used by the application communicating with the Broker. Only available if API version 9 or greater is used. | ||||||||||||||
| Library | Library name if Broker call is an RPC call. Only available for RPC clients, or for server version 8.0 or higher. | ||||||||||||||
| Program | Program name if Broker call is an RPC call. Only available for RPC clients, or for server version 8.0 or higher. | ||||||||||||||
| Brokerid | The Broker ID of the Broker call. | ||||||||||||||
The utility will only produce a meaningful result if the trace file is not corrupt. When transferring a trace from a mainframe, make sure all columns of the trace file are transferred, otherwise the utility might report errors (e.g. 2, 4 or 9). It is also possible that no errors are reported but the resulting CSV file has columns which contain invalid data.
| Number | Message | Explanation |
|---|---|---|
| 1 | {0} | Text of a Java exception thrown at runtime. |
| 2 | Trace has incomplete entry for Binpart, expected length = {0}, actual length = {1} | Will be displayed a maximum of 5 times. Output for Security Token, Password, and New Password may be corrupted. Typical reason: columns in the trace file were lost when copying the trace from the mainframe. |
| 3 | Physical user ID {0} has wrong length | Trace file is corrupt. |
| 4 |
Trace has incomplete entry for Key or Reply string |
Will be displayed a maximum of 5 times. Output for any value may be corrupted. Typical reason: columns in the trace file were lost when copying the trace from the mainframe. |
| 5 | More then one request per user: {0} | This is an error condition similar to the Broker error 0037 0197. |
| 6 | does not include prefix | Trace file is corrupt. |
| 7 | does not include unique ID | Trace file is corrupt. |
| 8 | does not include reply or key | Trace file is corrupt. |
| 9 | Trace output might be incomplete and/or erroneous | Output for any value may be corrupt. |
| 10 | Problem with file {0} | Problem with trace or output file. |
| 11 | Not enough memory to process trace, try increasing -Xmx or split trace | The Java runtime does not have enough memory to process the trace file. Increase the memory or delete unnecessary sections in the trace file. |
| 12 | SeqID "{0}" does not match "{1}" | The sequence ID of the request and the reply do not match. This may happen if the trace file is incomplete or corrupted. Otherwise contact Software AG support and provide the trace file. |
| 13 | Found: {0} | The text of a Broker error message found in the trace file is
displayed. All non-zero return codes and the result of
KERNELVERSION calls are displayed. This can be
configured using a tool parameter.
|
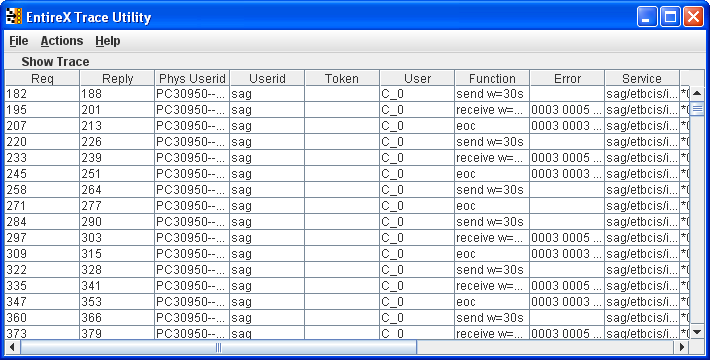
Show Trace enables you to display the values of a CSV file in a table (CSV=comma-separated values).
The first row of the file is used as the headers for the file.
The information in the tables can be sorted by descending or ascending order. The sorting is done alphabetically, not numerically.
To sort the information in a column by ascending order
Click on the header of the column.
To sort the information in a column by descending order
Use SHIFT and click on the header of the column.
You can load and save a CSV file using the options located in the File menu.
The EntireX Trace Utility is a graphical tool to process and display trace information. If the UNIX system does not have a graphical display (X-Windows), the EntireX Trace Utility can still be used as a command-line tool to process trace information.
To use the EntireX Trace Utility in batch mode
Enter the following command in the command line:
java -jar exxutil.jar [-option] filename [
output file

]
or
java -Xms64m -Xmx256m -jar exxutil.jar [-option] filename [
output file

]
This specifies an initial and maximum memory allocation pool for the Java runtime (the defaults are 2 MB and 64 MB).
The exxutil.jar file is located in the classes subdirectory of the EntireX installation. filename is the name of the trace file. The output will be written to the file specified with the parameter output file or, if no name is specified there, output will be written to the file filename.csv.
| Option | Description | ||||||||||
|---|---|---|---|---|---|---|---|---|---|---|---|
-version |
to display the version information | ||||||||||
-short |
to generate an overview | ||||||||||
-long |
to generate the full output | ||||||||||
-sep char |
the separator character used in the resulting CSV file, default is "," | ||||||||||
-type type |
|
||||||||||
-noshow param |
The utility displays all Broker errors found in the trace. To
prevent this either all errors or a set of specified errors can be excluded
from the display. To prevent the display of all errors specify "all" as
parameter. To prevent the display of specific errors specify the 8 digit error
class and number. Multiple errors can be specified separated by ":". Examples:
-noshow 00020002:00070007 or -noshow "0074 0074".
|
||||||||||
For the default and long display, filters can be specified:
| Option | Description |
|---|---|
-user < user > |
to get entries for a particular user |
-conversation < convid > |
for a particular conversation ID |
-service |
for a particular service |
If more than one filter is specified, only those entries which satisfy all conditions will be displayed.
java -jar exxutil.jar -long -sep ";" trace.txt
will generate all columns in a file trace.txt using ";" as separator character, the result will be in the file trace.txt.csv.
The utility will only produce a meaningful result if the trace file is not corrupt. When transferring a trace from a mainframe, make sure that all columns of the trace file are transferred. Otherwise the utility might report errors, e.g. error 2, 4 or 9. It may also happen that no errors are reported but the resulting CSV file has columns which contain invalid data.
The CSV file can usually be opened in Microsoft Excel by double-clicking
on the file name in the Windows Explorer. If the data is not displayed
correctly, the separator character used by the utility (default is ",") does
not match the list separator character used by Windows. Use the -sep option to
specify a different separator character. To check the list separator used by
Windows, go to .
Alternatively you may use the import functionality of Microsoft Excel. Open a spreadsheet, use . After selecting the file name (change default file type *.txt) the Text Import Wizard starts, which allows you to specify the delimiter (separator) character.
The following are some tips how to use Microsoft Excel as a tool for displaying and analyzing the CSV file. They refer to Microsoft Excel 2000.
Formatting the spreadsheet: use CTRL A to select all data, change the font size e.g. to 8, then use to format all columns. Make the first line a "header line": select the 2nd line, use . Now, when scrolling through the entries the header line always stays on top.
Enable filtering: select the 1st line, use . Now you have a drop-down box on each header entry that allows you to select a subset of the Broker calls.
You can sort the entries in the generated CSV file using the Reply column. Thus the ordering corresponds to the time when the Broker kernel sends back the reply for the Broker call. Calls where no reply can be found in the trace appear at the end. If you use the Request column as the sorting criteria, the Broker calls will be ordered corresponding to the time when the Broker call arrives at the Broker kernel.