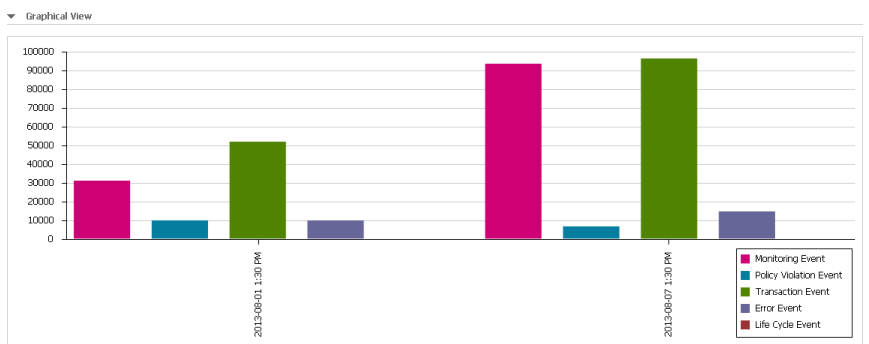
In this field... | Specify... |
Target | A target of the asset, or select All to view the event information of all targets to which the virtualized service is deployed. CentraSite displays None by default. |
Consumer | A consumer of the asset, or select All to view the runtime event information of all consumers of the asset. CentraSite displays All by default. However, if you do not have at least one consumer registered in the registry, CentraSite displays None by default. |
Event Type | A particular event type, or select All to view all event types. For a list of the supported event types, see The Runtime Events. CentraSite displays All by default. |
Date Range | A range of dates from which to view the events (e.g., Last 1 hour, Last 12 hours, Last 1 day, Last 5 days, Last 10 days, Last 20 days, Last 1 month, Custom, etc.). CentraSite displays Last 1 month by default. |
Start Date/End Date | If chosen Custom in the previous field, then the time period for which to view the metrics. Start Date: Click the calendar and select a starting date and time. End Date: Click the calendar and select a ending date and time. |
Display Interval | A running count events of the service displayed at regular time intervals. The interval is specified in the format 3m 2d 6h; wherein m indicates the month, d indicates the day and h indicates the hour. |

Field | Description |
Date/Time | The date/time that the event occurred. Click this hyperlinked value to view the Event Detail page, which will contain the event's SOAP request or response name in the Attribute column. Click the hyperlinked request or response name to display the full SOAP request or response. |
Event Type | (Read-only.) The type of event (e.g., Monitoring, Policy Violation, Error, etc.). |
Target | (Read only.) The target on which the event occurred. |