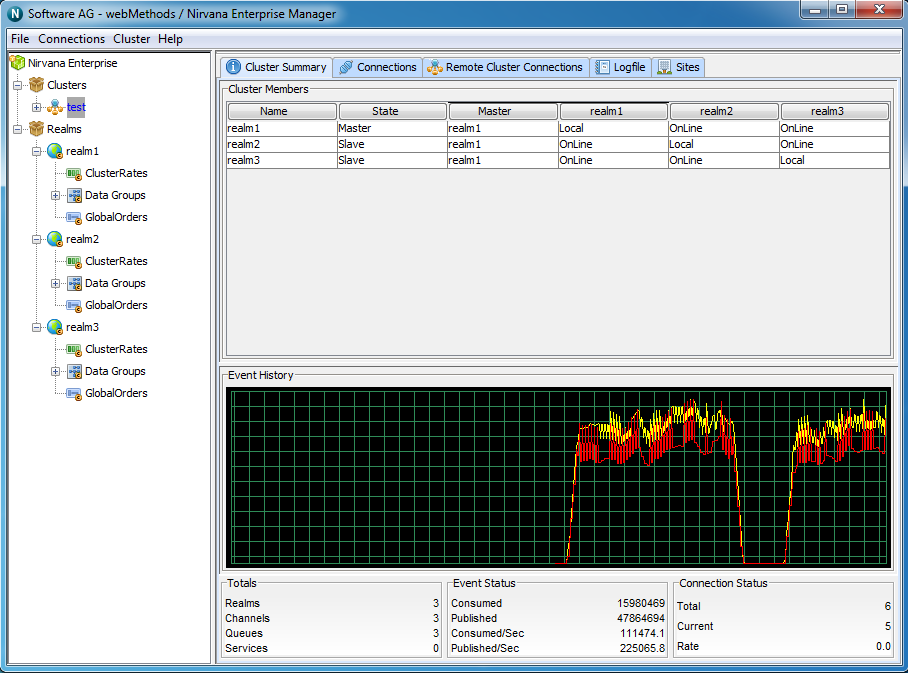
Universal Messaging Enterprise Manager - Clusters Status
The cluster status view provides an overview of the characteristics as well as current status of a selected Universal Messaging cluster.
This section will describe the type of status information that you can observe from the Cluster Status view.
The top of the screen displays a large real time graph illustrating the total number of events published (yellow) and consumed (red) across all Universal Messaging clusters.
The bottom of the screen displays 3 panels named Totals, Event Status and Connection Status. These panels and the information displayed are described below.
Totals
The Totals section describes the following :
 Realms
- The number of realms within the cluster
 Channels
- The number of channels that exist across all realms within the cluster
 Queues
- The number of queues that exist across all realms within the cluster
 Services
- Total number of services that exist across all realms within the cluster
Event Status
The Event Status section describes the following :
 Published
 - The total number of events published to all channels, queues and services across all realms within the cluster
 Consumed
 - The total number of events consumed from all channels, queues and services across all realms within the cluster
 Published/Sec
 - The number of events published to all channels, queues and services, per second across all realms within the cluster
 Consumed/Sec
 - The number of events consumed from all channels, queues and services, per second across all realms within the cluster
Connection Status
The Connection Status section describes the following :
 Total
Total - The total number of connections made to all realms within the cluster
 Current
 - The current number of events across all realms within the cluster
 Rate
Rate - The number of connections being made per second across all realms within the cluster
