This document covers the following topics:
The application monitoring MashApps read the data from a Microsoft SQL, Oracle or DB2 data collector database of webMethods. The default database is Microsoft SQL. For Oracle or DB2, you have to configure a data feed for the MashApp.
Three different MashApps are available for the following scenarios - they show and evaluate the data which is collected by the Application Monitoring Data Collector:
RPC
CICS ECI
IMS Connect
The following topics are covered below:
With the installation of the Application Monitoring Data Collector, the following files are copied to the /appmondc/mashapp directory of your Optimize installation:
M_Application Monitoring <version> <scenario>_<revision>_<date>-<time>.mzp
where <scenario> is one of the following: RPC, CICS or IMS.
Each of these files contains the application monitoring MashApp and the data feeds for viewing the monitoring data in a specific scenario.
TriggerExpirationOfDataInServerCache.csv
This file is used to trigger the expiration of data in the server cache every 5 seconds. This is required to provide real-time data instead of outdated data for some data feed operators.
SAG_Red.xml and SAG_Green.xml
These files contain additional color schemes for MashZone. They are used on the Distribution of Transactions tab to display the distribution of successful transactions in green color and the distribution of error transactions in red color.
Note:
Updated or corrected MashApps will be made available via Empower
(https://empower.softwareag.com/). To
find them, log in to Empower, go to Products > Download Components
> Optimize for Infrastructure and look for the component
"Application Monitoring MashApps". See the
corresponding readme file for update information.
To activate a MashApp, make sure you have a Professional, Enterprise or Event license file, that you have administrator rights, and then proceed as follows:
Copy the M_Application Monitoring <version> <scenario>_<revision>_<date>-<time>.mzp file for the desired scenario to the <installation-directory>/server/bin/work/work_mashzone_<t>/mashzone_data/importexport directory of your MashZone installation.
<t> indicates the type of the MashZone server. Types are s, m, and l. For example, work_mashzone_m for a medium type.
Copy the TriggerExpirationOfDataInServerCache.csv file to the <installation-directory>/server/bin/work/work_mashzone_<t>/mashzone_data/resources directory of your MashZone installation.
Copy the SAG_Red.xml and SAG_Green.xml files to the <installation-directory>/server/bin/work/work_mashzone_<t>/mashzone_data/assets/colorschemes directory of your MashZone installation.
Invoke MashZone.
Go to the Administration page (see the corresponding link at the top of the page) and then to the Import/Export/Delete page.
Import the M_Application Monitoring <version> <scenario>_<revision>_<date>-<time>.mzp file for the desired scenario using the import function.
By default, each MashApp uses SELECT statements for a
Microsoft SQL database. If you use an Oracle or DB2 database, you need to
configure the data feed "RTM 3.1 DBType" as follows:
Go back to the Home page (see the corresponding link at the top of the page) and then to the Data feeds tab.
Edit the data feed "RTM 3.1 DBType".
Look at the User input - Text box. You can see that the Debug value and Default value text boxes are preset with "Microsoft SQL".
Change both preset values to the appropriate database type: enter either "Oracle" or "DB2".
Save your changes to the data feed.
Furthermore, you need to install a database driver and set up a database connection to your Application Monitoring Data Collector database as described below.
MashZone currently supports JDBC database connections. They require system-specific JDBC drivers. For license reasons, MashZone does not come with database drivers.
Download the JDBC driver (jar files) for Microsoft SQL Server, Oracle or DB2 from a trusted internet site to the <installation-directory>/server/bin/work/work_mashzone_<t>/mashzone_data/jdbcdrivers directory. Sample jar files are:
For Microsoft SQL Server:
sqljdbc4.jar (com.microsoft.sqlserver.jdbc.SQLServerDriver)
For Oracle:
ojdbc14.jar (oracle.jdbc.OracleDriver)
For DB2:
db2jcc.jar (com.ibm.db2.jcc.DB2Driver)
Restart the MashZone server after the database driver has been copied.
For further information, see the MashZone help and the database-specific documentation.
For this step, make sure you have a Professional, Enterprise or Event license file for MashZone and that you have administrator rights for MashZone.
All data feeds which access the Application Monitoring Data Collector database use the alias "Optimize". Therefore, proceed as follows:
Go to the Administration page and then to the Database connections page.
Create a database connection to the Application Monitoring Data Collector which uses the alias "Optimize".
Select a previously installed database driver, for example:
com.microsoft.sqlserver.jdbc.SQLServerDriver
oracle.jdbc.OracleDriver
com.ibm.db2.jcc.DB2Driver
Enter the address of the database in the Database URL text box. With the address, also specify a database user ID and a database password. This is important because authentication is disabled in the data feeds which use a database source. The syntax within the URL depends on the database driver you are using. See the hints below or the relevant database documentation.
Recommendations:
In test cases, a Connection timeout and a Query timeout of 60 seconds have been working satisfactorily.
Set the Pool size to 12, because the start of the Application Monitoring MashApp is accelerated using simultaneous database connections.
Test the database connection. There is no need to specify the user and password if it has already been provided with the database URL.
For further information, see the MashZone help.
Different URL formats are used for the different databases.
Sample Database URL Format for Microsoft SQL
jdbc:sqlserver://<server-name-or-IP-address>:<port>;
DatabaseName=<database-name>;user=<uid>;password=<psw>[;connectOption=value...]
Sample Database URL Format for Oracle
jdbc:oracle://<server-name-or-IP-address>:<port>;
ServiceName=<oracle-service-name>
[;connectOption=value...]
or
jdbc:oracle:thin:<uid>/<psw>@<server-name-or-IP-address>:<port>: <oracle-service-name>
Sample Database URL Format for DB2
jdbc:db2://<server-name-or-IP-address>:<port>;
(DatabaseName=<database-name>|LocationName=<location-name>)
user=<uid>;password=<psw>
[;connectOption=value...]
If your database driver does not support the specification of a user
ID and password in the database URL, you can manually specify the user ID and
password in the data feeds which have database access. In this case, you need
to edit all data feeds which have "1DB" in their
names (for example, "RTM * 1DB1SE"). In the
Source: Database box of such a data feed, click on the
![]() button. In the resulting Select database
connection dialog box, enable authentication and specify a user ID
and a password.
button. In the resulting Select database
connection dialog box, enable authentication and specify a user ID
and a password.
Note:
You can obtain a sample URL from your webMethods installation at
Administration > System-Wide > Environments > Database Pool
Configuration. For MashZone, you must include the user ID and
password in the database URL.
When the values for Pool size, Connection timeout or Query timeout are too low, errors may occur in the MashApp which do not necessarily indicate the reason.
Examples of such error messages are:
A column named "CRITERION" does not exist in the table.
                  (Rename column)
A column named "BAM_FACT_APPLICA_V1_ID" does not exist in
                  the table. (RTM * 1DB1SE/Change data type)
A column named "TIMEINTERVAL" does not exist in the
                  table.
Such an error message occurs when a SELECT statement
cannot be completed because of a timeout. As a consequence, the columns usually
returned by the SELECT statement are not created for further
processing.
When your MashZone and the webMethods Collector database run on the same machine, network traffic will be reduced and you may gain performance advantages.
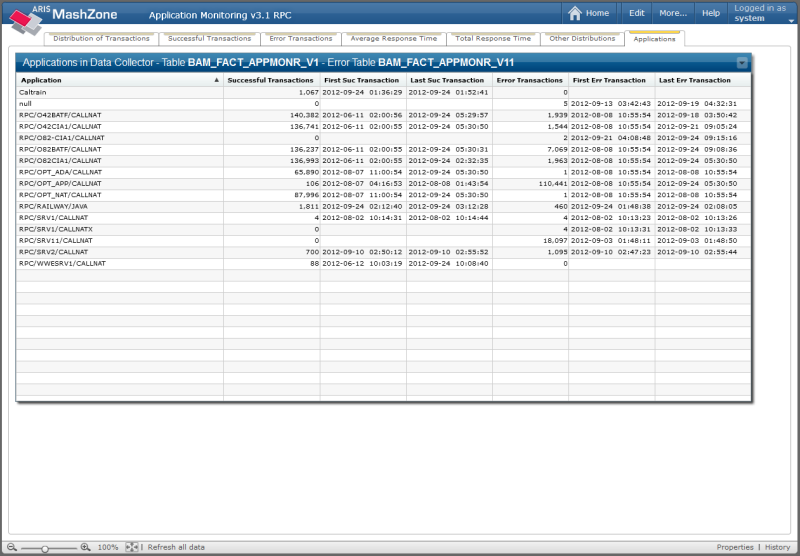
The performance of the MashApp depends on the amount of data in the Data Collector and the speed of the computer which hosts the Data Collector. Your database administrator can improve the performance by creating indices on the database tables which contain the monitoring data (an example is provided below). The names of the Data Collector tables are displayed in the header of the Applications tab. There is one table for the successful transactions and another table for the error transactions.
You can monitor the SELECT statements for the access of
the Data Collector tables with database performance tools and you can create
indices as suggested by the tool. Note that an index for one query may result
in a slower access for another query. Also, the effort to insert values into
the Data Collector column may increase if more indices are created. Therefore,
it is recommended that you ask your database administrator to optimize the
response times of the MashApp.
On the Successful Transactions tab, the transactions with the maximum recording times are selected by default (see the selection box on the left, immediately above the table). To accelerate the access to these transactions, your database administrator can create the following index in the Data Collector database:
CREATE INDEX RecTimeIX ON BAM_FACT_APPMONR_V1 (APPLICATIONNAME_DIM, entry_time DESC);
Note that the table name "BAM_FACT_APPMONR_V1" may vary.
Instead of the column entry_time for the selection of the
recording time, it is possible to use the following columns:
| Selection Criterion | Database Column Name |
|---|---|
| Response Time | APPMONRPCTIMERE_FACT |
| Client Layer Time | APPMONRPCTIMECL_FACT |
| Client Transport Time | APPMONRPCTIMECL5_FACT |
| Broker Time | APPMONRPCTIMEBR_FACT |
| Broker Wait Time | APPMONRPCTIMEBR4_FACT |
| Server Transport Time | APPMONRPCTIMESE8_FACT |
| Server Layer Time | APPMONRPCTIMESE_FACT |
| Server Program Time | APPMONRPCTIMESE7_FACT |
| DB Call Time | APPMONRPCTIMEDB_FACT |
| DB Transport Time | APPMONRPCTIMEDB6_FACT |
| DB Calls | APPMONRPCDBCALL_FACT |
| RPC Call Length Total | APPMONRPCLENGTH3_FACT |
| RPC Call Length Request | APPMONRPCLENGTH2_FACT |
| RPC Call Length Reply | APPMONRPCLENGTH_FACT |
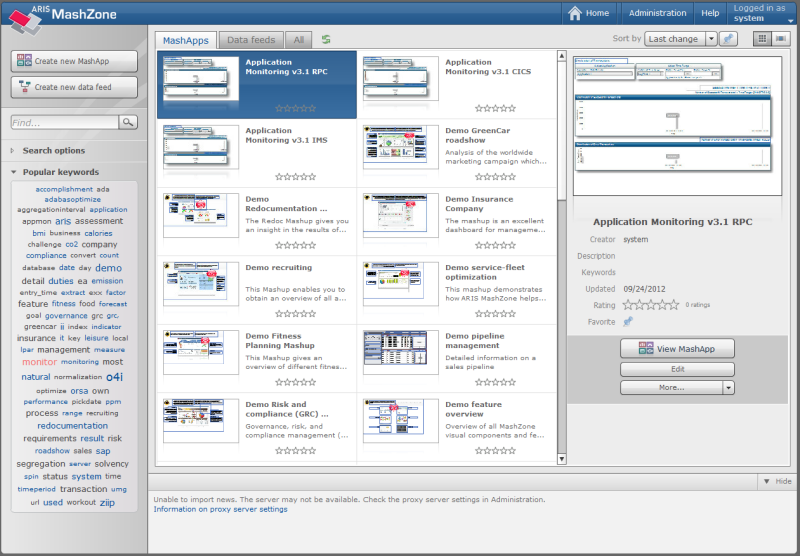
After you have specified all required information as described above, you can open the MashApp for your scenario.
Note:
This section explains how to use the "Application
Monitoring" MashApp for the RPC scenario. The handling for the
CICS and IMS scenarios is similar to the RPC scenario described below. However,
the CICS and IMS scenarios have less KPIs than the RPC scenario, and there are
less columns on some of the tabs. See also KPI Definitions for Application
Monitoring.
Note:
Alternatively, you can create an HTTP link to the MashApp (see the
section in the MashZone help which explains how to copy the MashApp address to
the clipboard). In this case, you can specify startup values for the MashApp
(for example, a custom range instead of the default time range
"Last hour").
The MashApp consists of seven tabs. The first six tabs show monitoring data. The seventh tab shows the applications which are defined in webMethods.
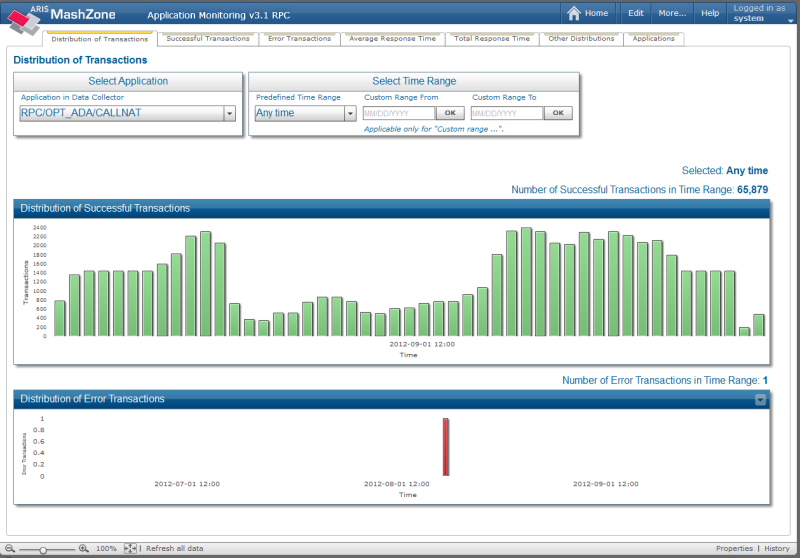
On the first six tabs, a common master view is shown at the top of each tab. The master view contains the following:
A selection box for the application. By default, the first application in the selection box is selected. This is the application which has been created first.
A selection box and two input boxes for selecting a date/time range. You can select the following predefined date/time ranges:
Last 10 minutes
Last hour (default)
Last 12 hours
Last 24 hours
Last 7 days
Last 4 weeks
Any time
Alternatively, you can select Custom range:
Custom Range From defines the date from which on transactions are considered. If empty, all transactions starting with the first recorded transaction are shown.
Custom Range To defines the date until which transactions are considered. If empty, all transactions up to the current date/time are shown.
If both Custom Range From and Custom Range To are empty, no transactions are shown.
The number of transactions in the selected date/time range is shown above the tab-specific table or chart.
All time values that are shown in the MashApp apply to the local time zone of your Optimize database.
The different tabs are described in the topics below:
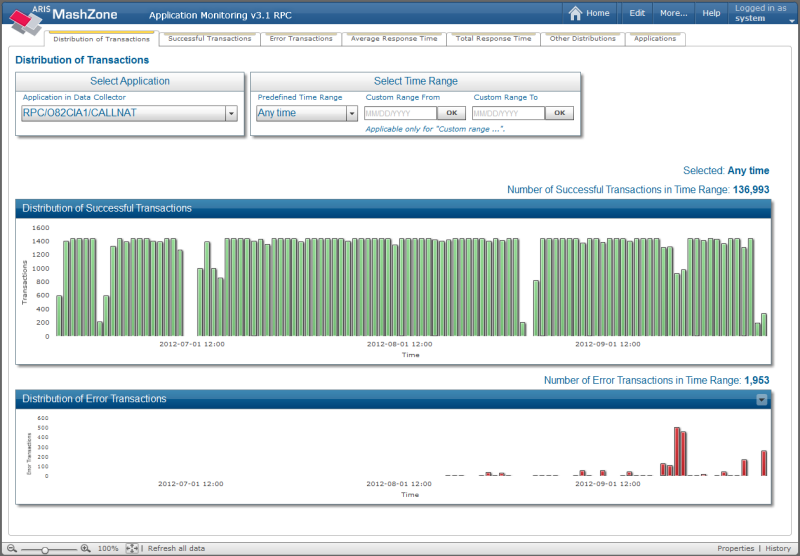
The Distribution of Transactions tab shows how many successful transactions and how many error transactions have been recorded in the selected time range. The date/time unit shown in the column chart depends on the selected time range. It is "minute" if the time range is 24 hours or less. Otherwise, the date/time unit is "day". For DB2, it is always "day".
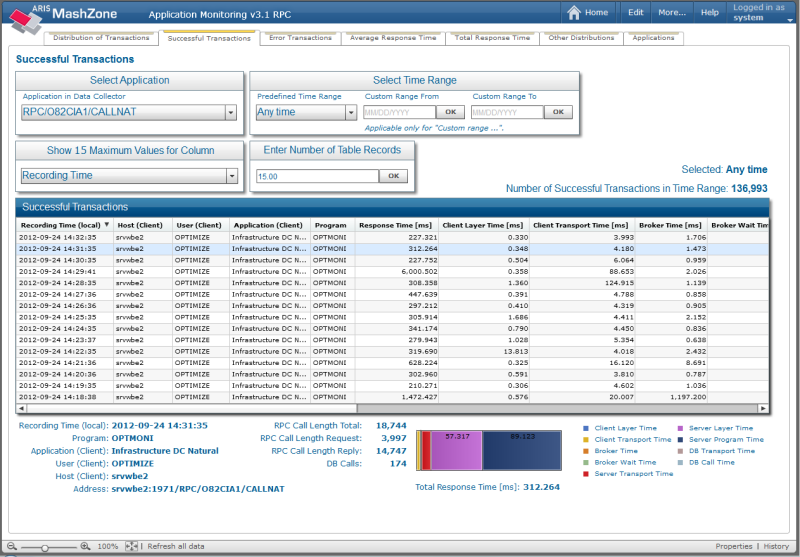
The Successful Transactions tab shows the successful transactions in the selected date/time range. By default, the 15 last transactions (with the highest or maximum recording time) are shown. You can change the number of the transactions that are displayed. The maximum number of shown transactions is 10,000. Instead of the recording time, you can select another table column in the selection box above the transaction table for which the maximum values are to be displayed.
You can also change the sorting of the table by clicking on the header of a single table field. By default, the table is sorted by Recording Time in descending order.
When you select a successful transaction by clicking on it, all available column values are shown and the distribution of the measured times is visualized in a bar chart below the transaction table. Initially, no transactions are shown.
The Error Transactions tab shows the error transactions in the selected date/time range. By default, the 15 last transactions (with the highest or maximum recording time) are shown. You can change the number of the transactions that are displayed. The maximum number of shown transactions is 10,000. Instead of the recording time, you can select the error response time in the selection box above the transaction table from which the maximum values are to be displayed.
You can also change the sorting of the table by clicking on the header of a single table field. By default, the table is sorted by Recording Time in descending order.
When you select an error transaction by clicking on it, all available column values are shown below the transaction table. Initially, no transactions are shown.
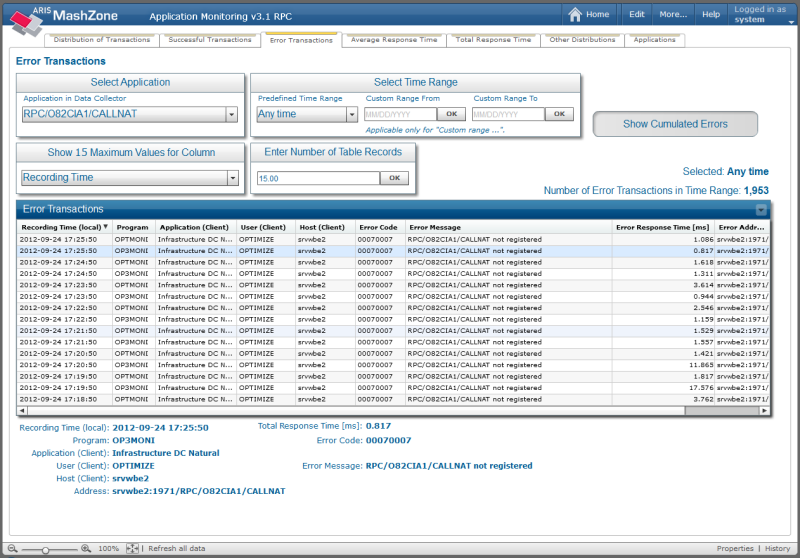
Using the button, you can display an overview of all error codes. For each error code, you can see how often this error has occurred.
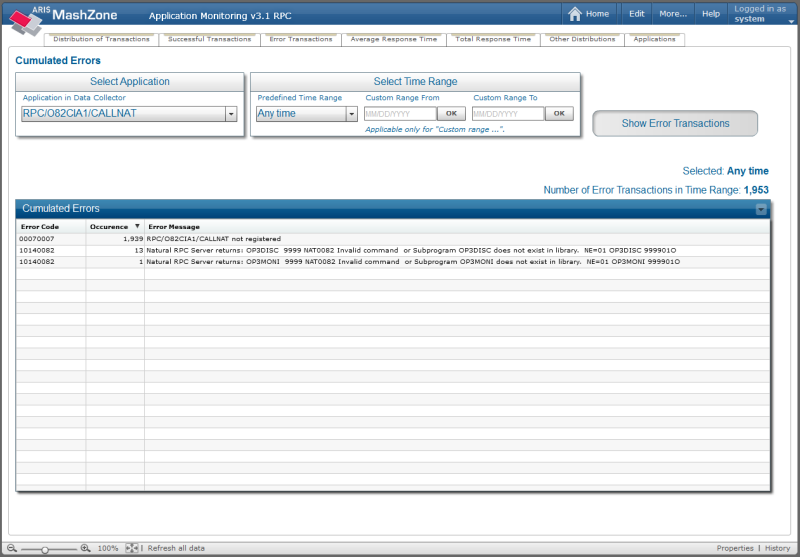
Using the button, you can return to the list of error transactions.
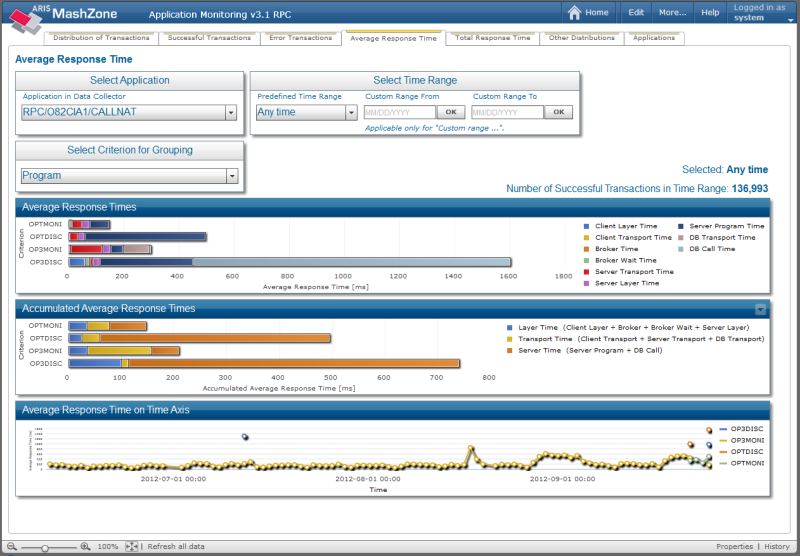
The Average Response Time tab shows the average response times of the selected transactions grouped by program, client application, client user or client host. Due to heavy database calculations, this tab may have especially long response times with a high-volume database.
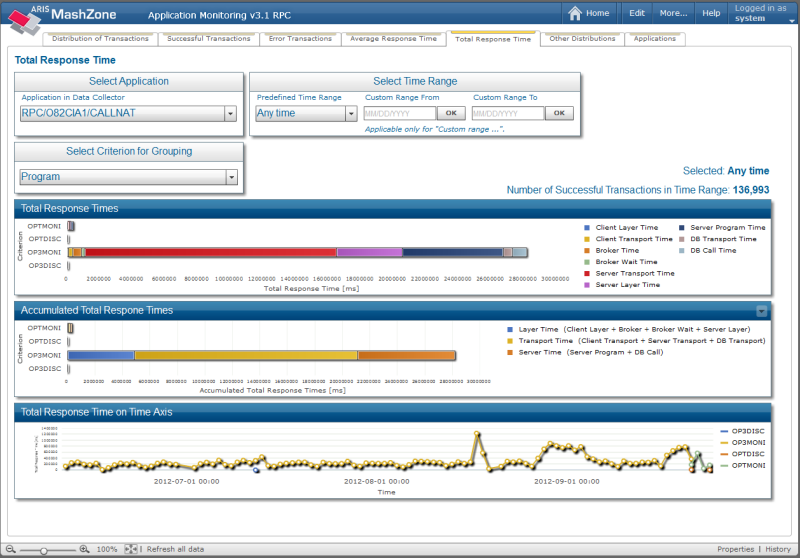
The bar chart at the top shows the distribution of the single measured times.
The bar chart in the middle shows the measured times in three groups: layer time, transport time and server time.
The line chart at the bottom shows how the average response time is spread over the selected time unit. The date/time unit shown in the line chart depends on the selected time range. It is "minute" if the time range is 24 hours or less. Otherwise, the date/time unit is "day". For DB2, it is always "day".
The Total Response Time tab shows similar information as the Average Response Time tab. The only difference is that the added response times are shown instead of the average values.
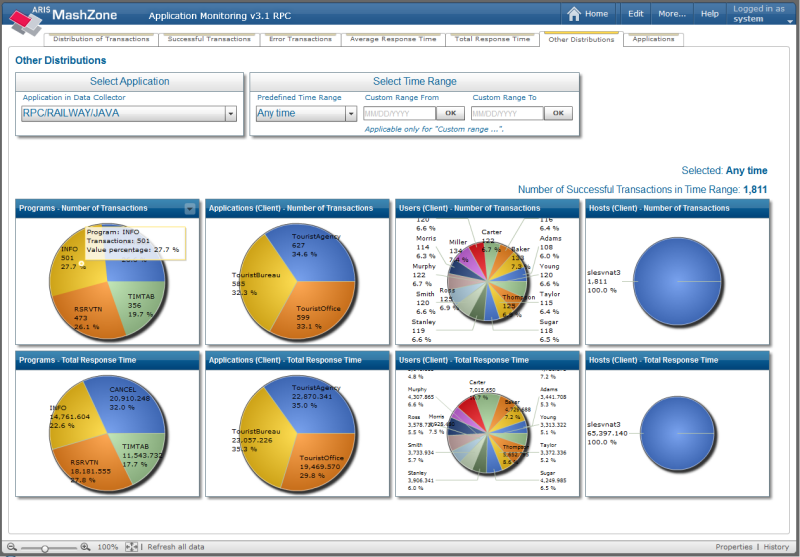
The Other Distribution tab shows eight pie charts. These are the distributions of the number of transactions and the total response times for programs, client applications, users and hosts. Due to heavy database calculations, this tab may have especially long response times with a high-volume database.
The Applications tab shows a table which lists all applications that are found in the webMethods Data Collector database. These are the applications which are defined on the webMethods dimension level.
For each application, the number of successful transactions and the number of error transactions is shown. In addition, the following is shown for each type of transaction: date and time of the first transaction and date and time of the last transaction.