This document covers the following topics:
Optimize enables you to collect response time data from your distributed applications and to monitor all Software AG component resources in real time. The Optimize solution for Software AG's Enterprise Transaction Systems makes use of the following components: Infrastructure Data Collector, Application Monitoring Data Collector, Web Service Data Collector, and Optimize.
The Application Monitoring Data Collector collects the response time data of each involved software component of selected synchronous EntireX RPC services. The Application Monitoring Data Collector sends the measuring points to Optimize. ARIS MashZone can be used to display the results.
The Infrastructure Data Collector monitors the system and operational data associated with Software AG runtime components (such as Integration Servers, Broker Servers, Brokers, adapters, Adabas, ApplinX, Natural, Com-plete, EntireX as well as associated Adabas and Natural subproducts) and reports the status of these components with Optimize for Infrastructure. You use Optimize for Infrastructure to monitor the status of individual managed objects as well as the overall status of your system.
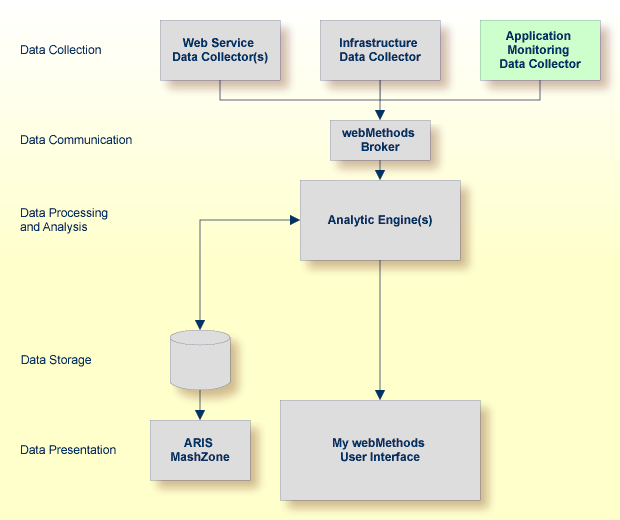
Optimize implementations perform the following main functions:
data collection
data communication
data processing and analysis
data storage
data presentation
Each subcomponent can reside on its own separate host, or all subcomponents can reside on the same host.
The existing Optimize product was extended for monitoring Software AG's enterprise products. In Optimize, no special handling is required for the enterprise products: the installation is done with the Optimize installation and you can use the My webMethods user interface or ARIS MashZone as the presentation layer.
A typical Optimize implementation for monitoring both the response-time data of your client applications (using the Application Monitoring Data Collector) and the infrastructure data of Software AG's enterprise products (using the Infrastructure Data Collector) is shown in the graphic below.
Optimize also includes a Web Service Data Collector which can be used to display data in the form of custom KPIs. A Natural API is provided for simple usage of this Web Service Data Collector from Natural applications.
Application monitoring adds new value to monitoring. It enables you to monitor the response times in your distributed applications.
When a service has been selected for monitoring, each call to the service by a client application is monitored. The overall service response times, the network transport times, the EntireX Broker processing and waiting times, the RPC (remote procedure call) server processing times, and the time spent for database calls are measured. Each involved Software AG enterprise product concatenates the monitored time(s) with the service call. When the call returns to the client, the client RPC runtime provides the event data to the Application Monitoring Data Collector, which then provides the data to Optimize. Optimize stores the event data in the data storage so that you can later visualize the data using ARIS MashZone.
If you want to use application monitoring, you have to make sure that the following additional Optimize component has been installed with the Software AG Installer:
Application Monitoring Data Collector
The collection of response times and other measuring data from your distributed application in real time requires that you set up various components for application monitoring. See Setting Up Application Monitoring for detailed information.
The following graphic illustrates an example of an RPC scenario in which the EntireX Broker is used. The boxes in the graphic contain the components that are running in your production environment. The components in the blue boxes can be monitored by Optimize. The components in the grey boxes cannot be monitored. The small blue box linked to the "Client Application" box represents the client RPC layer which can be monitored, whereas the client application itself cannot be monitored. Note that the time spent for database calls can only be monitored if the call is issued by a Natural RPC server. The yellow boxes represent all items which are required for collecting data and for measuring the response times. The black lines stand for calls from the client application. The red lines stand for the measuring data which are being transported.
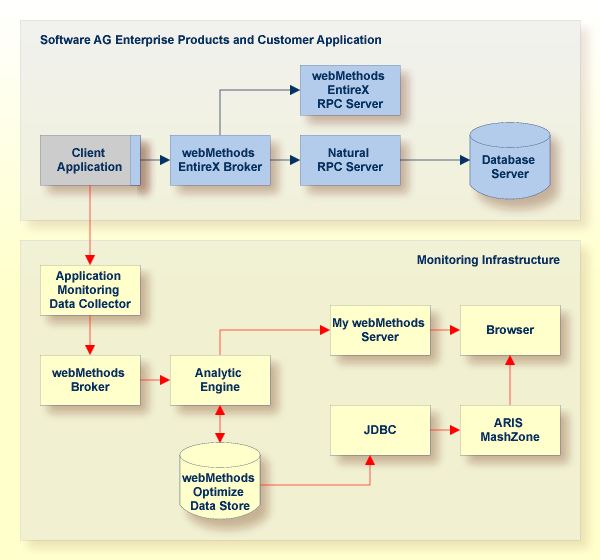
Note:
See also Components Which Support Application
Monitoring.
The following graphic shows the detailed meanings of the response time KPIs that are collected by the Application Monitoring Data Collector. As an example, a remote procedure call (RPC) from a client application to a server program is illustrated. For a Natural server program, database calls can be monitored; this is illustrated on the left side of the graphic. Note that the database transport time (Time - DB Transport KPI) is only available for a database call against an Adabas server. For other databases, the database transport time is included in the database calls time (Time - DB Calls KPI). The right side illustrates a non-Natural server program where database calls cannot be monitored.
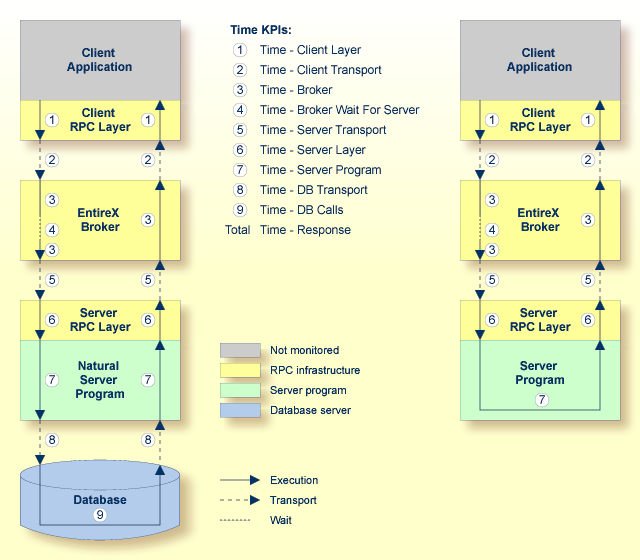
The client application issues a remote procedure call and the client RPC layer gets control. At the end of a transaction, the client RPC layer gives the control back to the client application. The time spent in the client RPC layer is monitored by the Time - Client Layer KPI.
The client RPC layer calls the EntireX Broker. The transport time between the client RPC layer and the EntireX Broker plus the transport time spent on the way back is monitored by the Time - Client Transport KPI.
The time spent in the EntireX Broker is monitored by the Time - Broker KPI. The KPI value does not include the amount of time that the EntireX Broker spends waiting for an available server.
The amount of time that the EntireX Broker spends waiting for an available server is monitored by the Time - Broker Wait For Server KPI.
When the EntireX Broker calls the server program, the server RPC layer receives the call first. The transport time between the EntireX Broker and the server RPC layer plus the transport time spent on the way back is monitored by the Time - Server Transport KPI.
The time spent in the server RPC layer is monitored by the Time - Server Layer KPI.
The server RPC layer forwards control to the Natural server program. The time spent in the Natural server program is monitored by the Time - Server Program KPI. The KPI value does not include the time spent for database calls.
The Natural server program calls a database. The transport time between the Natural server program and the database plus the transport time spent on the way back is monitored by the Time - DB Transport KPI. This KPI is only available for Natural RPC servers issuing database calls against an Adabas server.
The time spent for database calls is monitored by the Time - DB Calls KPI. For non-Adabas databases, the KPI value includes also the transport time required to reach the database server. This KPI is only available for Natural RPC servers.
The Time - Response KPI reflects the complete response time on the round trip from the client to the server. It is therefore the sum of the KPIs mentioned above.
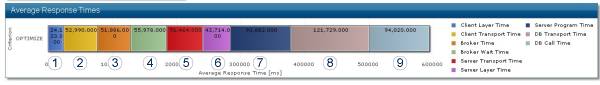
When the application monitoring data is shown in ARIS MashZone, the total response time is represented in a bar chart in which each single time KPI is reflected in a section of the bar. In the following ARIS MashZone example, the time KPIs are labeled with the same numbers as in the above graphic. At a glance, you can find out how much response time was spent for each part of the distributed application.
With infrastructure monitoring, Software AG's enterprise products such as Adabas, ApplinX, EntireX or Natural are polled for infrastructure monitoring data. The Infrastructure Data Collector initiates the polling in regular intervals and receives the monitoring data which is then stored in the data storage. You can find out, for example, the number of calls to a database in the interval, the number of calls to EntireX Broker in the interval, the number of logons denied in Natural Security, and many more. Diagrams showing the values of the KPIs (key performance indicators) over time are visualized in the My webMethods user interface.
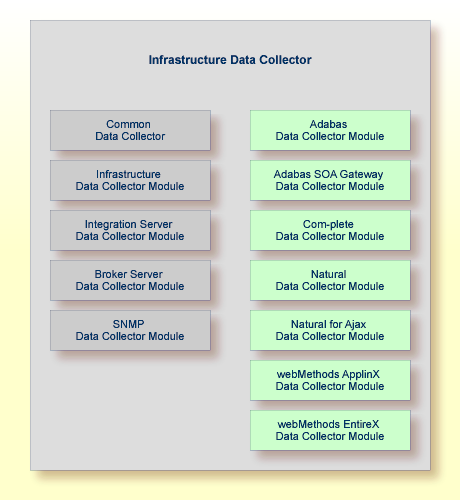
The Infrastructure Data Collector contains the following additional packages which, if enabled, allow the collection of data from Software AG's enterprise products:
AdabasDC
SOAGatewayDC
ApplinXDC
CompleteDC
EntireXDC
NaturalDC
NaturalAjaxDC
The available packages are illustrated in the graphic below.
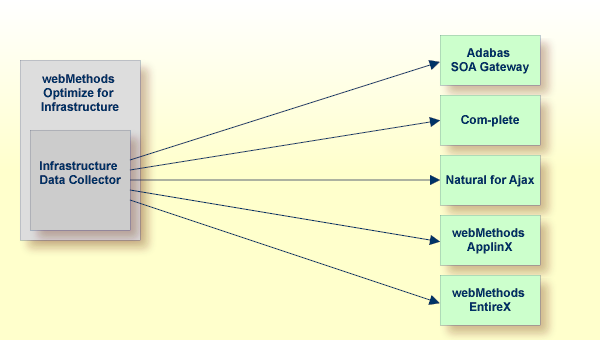
For monitoring Software AG's enterprise products and components, specific environments have to be set up. In principle, there are two types of environments:
Some products (Adabas SOA Gateway, Com-plete, Natural for Ajax, webMethods ApplinX and webMethods EntireX) can be monitored directly. Besides Optimize for Infrastructure and the monitored product, no further infrastructure is necessary.
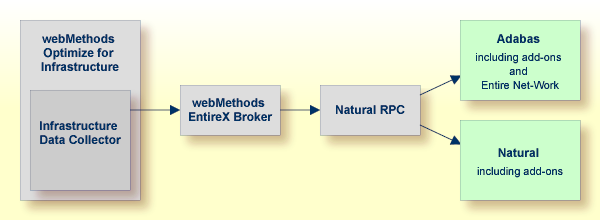
Other products (Adabas, Natural and Entire Net-Work) are monitored using a Natural RPC server. In addition to Optimize for Infrastructure and the monitored product, Natural, an EntireX Broker and Broker stubs have to be available.
One or more Natural RPC servers have to be set up for the diverse environments to be monitored. The products and components that can be monitored depend on the RPC server type. For example, a batch server monitors all global Natural components; a CICS server monitors in general only local environment-specific Natural components.
For further information, see Setting Up Infrastructure Monitoring.
The Software AG enterprise products listed below can be monitored if they are installed in your environment.
Adabas
Adabas Caching Facility
Adabas Delta Save
Adabas Event Replicator
Adabas Fastpath
Adabas Review
Adabas SAF Security
Adabas SOA Gateway
Adabas Transaction Manager
Com-plete
Entire Net-Work
Entire Operations
Entire Output Management
Entire System Server
Natural 1
Natural Advanced Facilities
Natural Connection 2
Natural Development Server
Natural for Ajax
Natural for DB2 2
Natural for VSAM 2
Natural Review
Natural RPC 2
Natural SAF Security
Natural Security
Natural SQL Gateway 2
Natural Web I/O Interface (server)
webMethods ApplinX
webMethods EntireX
zIIP Enabler for Natural 2
1 Some Natural components such as Natural for Adabas require the Natural Optimize Monitor Buffer Pool for the monitoring and are therefore only supported under z/OS with Natural 8.2.
2 This product requires the Natural Optimize Monitor Buffer Pool for the monitoring and is therefore only supported under z/OS with Natural 8.2.
Adabas
Adabas SOA Gateway
Entire Operations (UNIX only)
Entire Output Management (UNIX only)
Natural
Natural for Ajax
Natural Security
webMethods ApplinX
webMethods EntireX
Optimize will not replace any of Software AG’s existing monitoring tools. All monitoring components in the different products have special assignments and will be developed further, in parallel to Optimize.
System Management Hub is a central administration tool for Adabas and EntireX which offers snapshot monitoring capabilities. Optimize will not have any impact on the development of System Management Hub.
Special monitors such as Review will not be replaced by Optimize. In the future, they will be enhanced in such a way that they deliver data to Optimize. Review Natural Monitor has already been adapted and will deliver additional value to Optimize, if available.