
This document describes information and tracing screens in the IS Administration Console. It covers services and screens on the following information types:
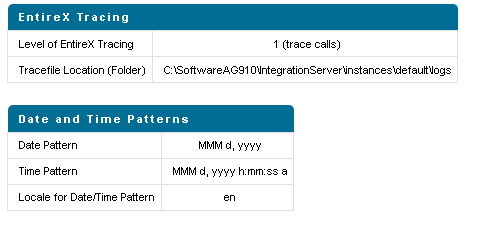
The first part of this screen shows the current level of EntireX Tracing.
The second part shows the setting for the Date and Time format patterns.
You can change these values with the Change Settings link. This has immediate effect.
For the Date and Time format patterns, the syntax of the Java class java.text.SimpleDateFormat is used.
Localized date and time pattern strings are also supported.
In these strings, the pattern letters described above may be replaced with other, locale-dependent, pattern letters using
the specified locale.
The default value appears when a field is left empty.
The adapter uses the logging facility of the Integration Server. The facility code is "0800" for the EntireX Adapter. The logging level specifies the amount of data logged. These log entries are written to the server log file.
This screen displays the following sections about connections and listeners.
Broker Information
The status of all brokers used in the connections. A green dot shows
that a connection to the broker is successful. As status, the version and the
operating system platform is displayed. A red dot shows that a connection to
the broker is not possible. As status, the error message is displayed.
Connections for Services
The status of the external servers such as RPC Server, IMS Connect and
CICS ECI used by the connections for adapter services. A green dot shows that
connection to the RPC server is successful and the status information from the
server is displayed. A red dot shows that a connection to the RPC server or to
the Broker is not possible. As status, the error message is displayed. The
current number of connection instances is shown in column
Count.
Connections for Listeners
For each Listener the corresponding name of the connection, Broker ID,
and server address is displayed.
The information on connections and listeners shown on the IS Administration Console's page is available with built-in services. The following services are available in the WmEntireX package. Parameters are either input or output (I/O).
| Service | Parameter | I/O | Description | |||
|---|---|---|---|---|---|---|
|
brokerID String |
I | ID of the broker to be pinged. | |||
refreshData String |
I | The number of milliseconds to refresh the data. If refreshData is null or not a number, the default of 10 seconds is used.
|
||||
errorFlag String |
O | "true" if an error occurred, "false" if the call succeeded. | ||||
message String |
O | The result of the ping call to the broker.
|
||||
|
refreshData String |
I | The number of milliseconds to refresh the data. If refreshData is null or not a number, the default of 10 seconds is used.
|
|||
brokerID String[] |
O | The array of broker IDs. | ||||
|
refreshData String |
I | The number of milliseconds to refresh the data. If refreshData is null or not a number, the default of 10 seconds is used.
|
|||
listeners IData[] |
O | The array of IData objects containing three strings name, brokerID, serverAddress for each listener.
|
||||
|
connection String |
I | The name of the connection to ping, e.g. "folder:name".
|
|||
refreshData String |
I | The number of milliseconds to refresh the data. If refreshData is null or not a number, the default of 10 seconds is used.
|
||||
errorFlag String |
O | "true" if an error occurred, "false" if the call succeeded. | ||||
message String |
O | The result of the ping call to the connection.
|
||||
|
refreshData String |
I | The number of milliseconds to refresh the data. If refreshData is null or not a number, the default of 10 seconds is used.
|
|||
connections String[] |
O | The array of connection names in the format folder:connection.
|
Connections, adapter services and adapter listeners contain metadata
that is generated during deployment of connections and services. Use the
service pub.wmentirex.supportinfo:createInfo to extract this
metadata for support purposes and error diagnosis.
| Service | Parameter | I/O | Description | |||
|---|---|---|---|---|---|---|
|
packageName String |
I | The name of a package. The generated metadata for all connections, adapter services and adapter listeners in this package is written to a file. | |||
result String |
O | File <filename> created on host <hostname>. |
This screen shows statistics about the adapter services of the EntireX Adapter. Only services that have been executed at least once during the runtime of the Integration Server are shown.
The following information is shown for each service:
name of the service
corresponding program name
number of successful calls
number of erroneous calls
average processing time in milliseconds (only successful calls)
time of last access
processing time in milliseconds for the last call
status of last call (detailed error message if the last call failed)
Note:
All these items except the service name can be reset with the link
"Reset Statistics".
This screen shows statistics about the listeners of the EntireX Adapter. For each listener, all services that have been invoked at least once during the runtime of the Integration Server are shown.
The following information is shown for each service invoked by a listener:
name of the listener
subprogram name and service name separated by '/'
number of successful calls
number of erroneous calls
average processing time in milliseconds (only successful calls)
time of last access
processing time in milliseconds for the last call
status of last call (detailed error message if the last call failed)
Note:
All these items except the listener and subprogram/service name can be reset with the link Reset Statistics.
This screen shows information on the license used by the EntireX Adapter.
Valid until: values are a date specification or "Unlimited".
License for connections to IMS Connect: "Yes" or "No".
License for connections to CICS ECI: "Yes" or "No"
License for Direct RPC connections: "Yes" or "No".
License for EntireX Broker connections: "Yes" or a message that indicates a possible license coverage mismatch.
Error message (only if the license is not granted).
Notes:
Application Monitoring is an EntireX feature that enables you to monitor the response times in your distributed applications, and it also enables you to monitor certain error situations. See Application Monitoring.
 To enable application monitoring for Direct RPC, IMS Connect and CICS
ECI
To enable application monitoring for Direct RPC, IMS Connect and CICS
ECI
In the administration menu of the EntireX Adapter, choose Application Monitoring.
In the Configuration section, enable Application Monitoring.
In the configuration entry Application Monitoring Data Collector ID, enter the address of the Application Monitoring Data Collector.
The address has the format host-name:port-number, where host-name is the host on which the Application Monitoring Data Collector is running and port-number is the port number of the Application Monitoring Data Collector. The default port number is 57900.
Caution:
If you have a Direct RPC scenario and you change the
application monitoring configuration, all involved client applications and/or
RPC servers have to be restarted (because they are caching information about
the Adapter's application monitoring settings).