MashZone NextGen Visual Analytics
Visual Analytics is a data discovery and exploration server with a web browser-based user interface that leverages the latest technologies of D3, AngularJS, and HTML5. Visual Analytics enables you to interactively visualize, explore, analyze, and blend historical and streaming data from multiple sources, and to discover and analyze data sets. You can do the following:

Explore and analyze historic data from sources such as CSV and JSON files and real-time data streams using interactive visualizations with options such as line, scatter, and contour. Streaming is supported via embedded
Apama capabilities (see
Detecting and Analyzing Complex Patterns in
Real Time.
Auto-discover and deploy new data sets. Auto-discover uses time stamps, dimensions, and measures.
Gain data insights via automatic statistical profiles, such as number of unique values, distribution of values, number of instances, distribution, sum/mean/min/max, and standard deviation.
Filter data using auto-generated statistical ranges for measures, dimension values, and so on.
Capture, save, and share data explorations with others.
Highlight and color visualizations using dimensions and other measures.
Visual Analytics also provides direct connectivity to consume data from other Software AG products such as Terracotta.
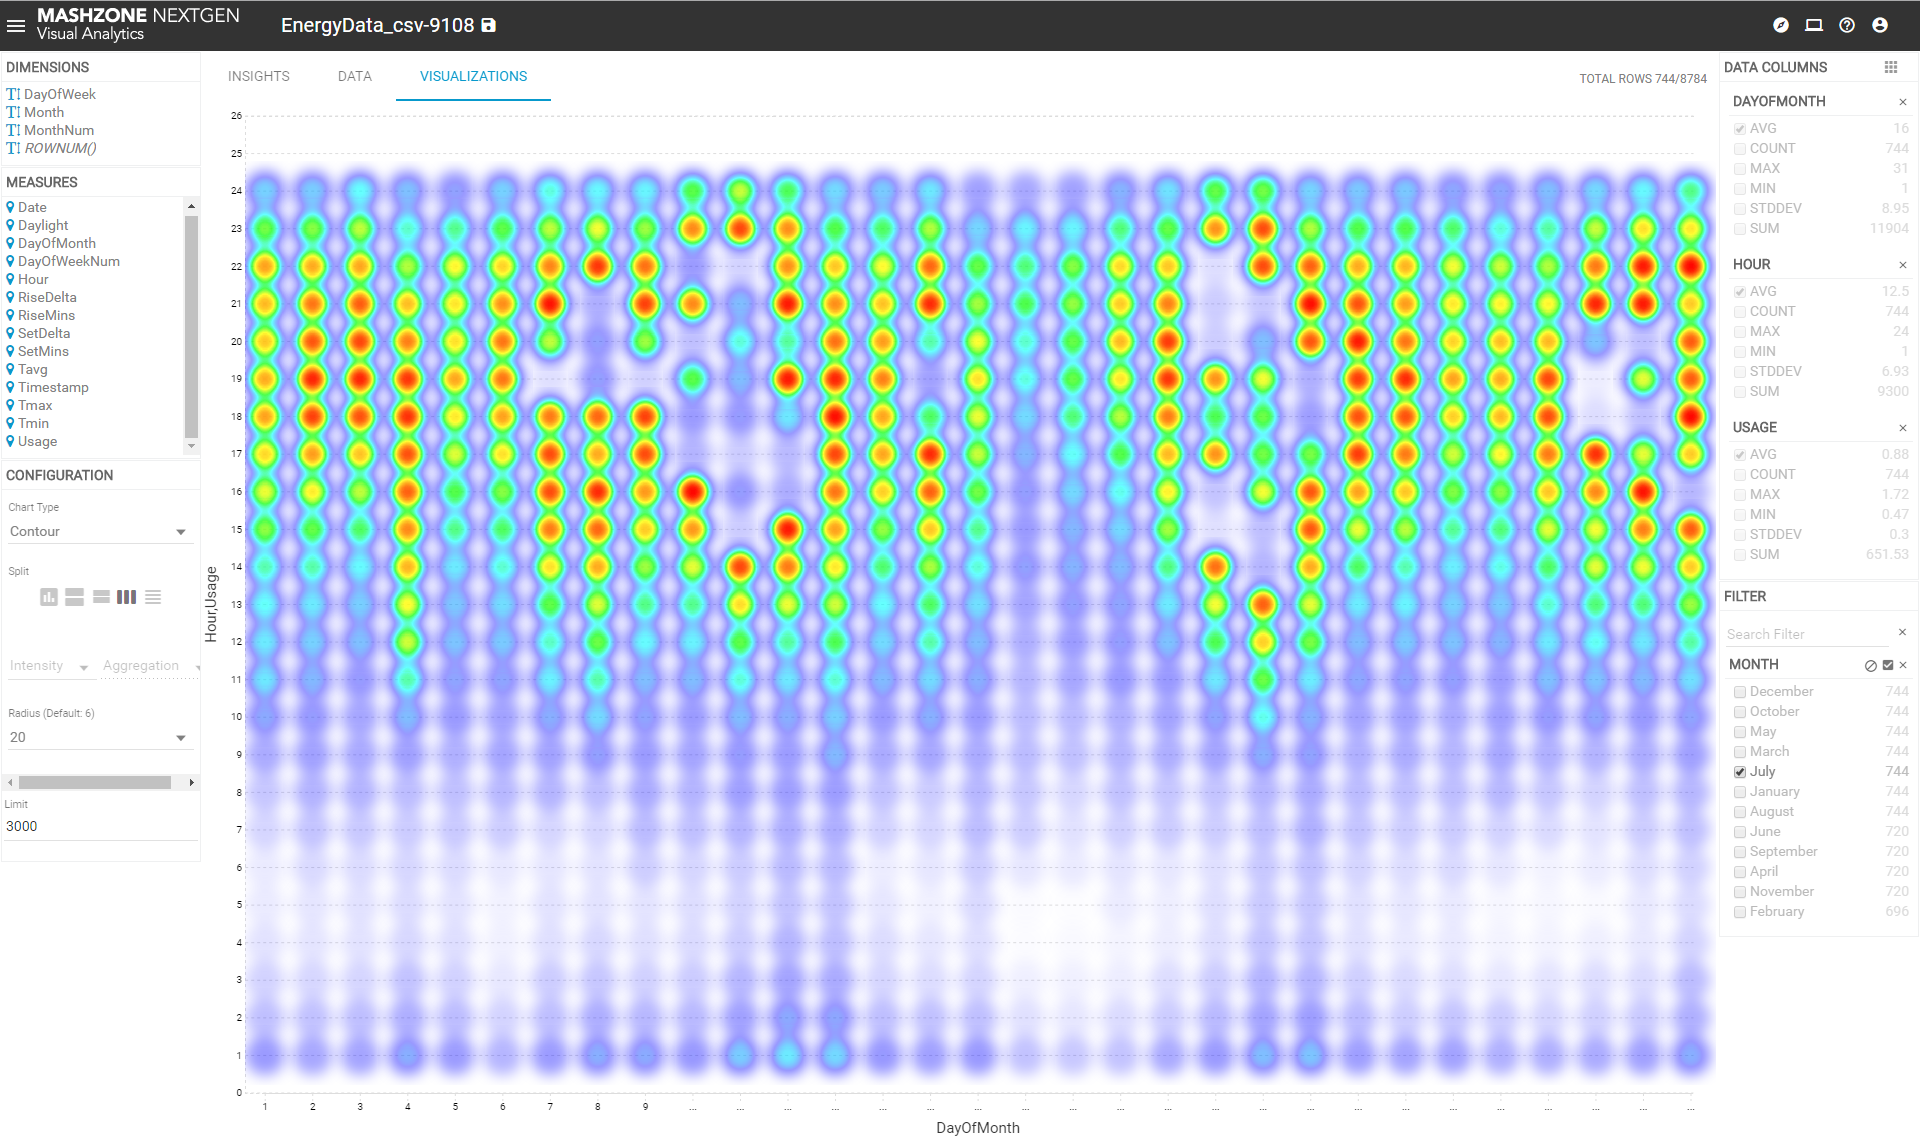
Visual Analytics makes it easy to discover relationships in your data. The illustration below shows how three measures can be analyzed at once to create a contour chart. The contour chart uses the third measure as a 'heat map' to color the data instances.