Knowledge map
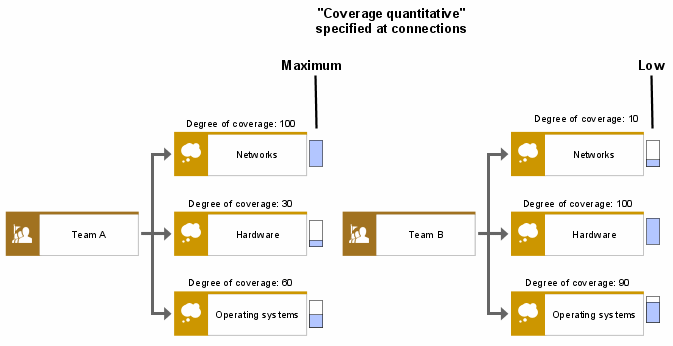
A knowledge map depicts the organizational distribution of knowledge categories. Various object types of the organization view (e.g., Organizational unit, Position, Person, Location, Group) can be connected to knowledge categories using has at disposal connections. In addition to the fact that a particular person or organizational unit has knowledge in a particular category, the degree of coverage can also be specified. The has at disposal connection contains the Degree of coverage attribute, which can express the degree of knowledge coverage in the selected category for the relevant organizational unit as a percentage. A value of 100% stands for maximum coverage, while a value of 0% means that absolutely no knowledge exists for the category under consideration. This is equivalent to the absence of the above-mentioned connection. In addition to this quantitative assessment, a qualitative assessment that can be displayed in the form of a graph can be performed. This is the purpose of the Coverage quality connection attribute, which can have the values Low, Average, High, and Maximum. This information can be visualized by graphic symbols at the connections as shown in the following figure. There is no direct relation between the values of the Degree of coverage and Coverage quality attributes. If both attributes are used, it is advisable that the qualification Low be used for a degree of coverage of up to 25%, Average for 26-50%, High for 51-75%, and Maximum for 76-100%.
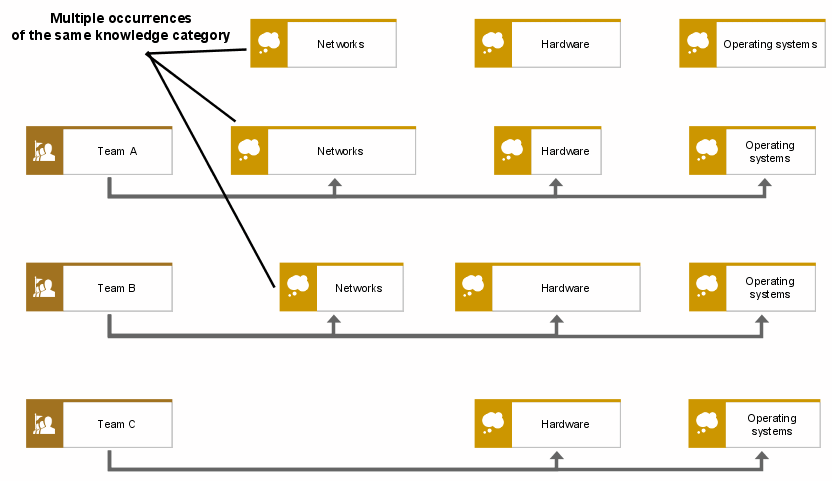
The knowledge map shown in the following figure focuses on organizational units, i.e., all relevant knowledge categories are specified for each organizational unit. It is also possible to use the knowledge categories as the central objects of consideration and add all relevant organizational units to them. The navigation options in ARIS (Relationships tab in the Properties - Object dialog) make it easy to find other existing relationships of an organizational unit or a knowledge category in both cases. Knowledge maps are often represented in the form of a matrix. The matrix representation can be achieved by arranging several occurrences of the same knowledge category in column format as shown in the following figure. In this example, the names are visible only for the knowledge categories displayed at the top, which look similar to the header of a table. For the other occurrences, the names were removed via the attribute placement function. This figure also shows an alternative visual representation option for differing degrees of coverage: the knowledge categories are scaled in different sizes.


