Business segment matrix
In the business segment matrix, the various markets in which a company is active are shown in an overview and their significance for the success of the company is shown in visual terms.
Each market is described by

the product or service offered and

the customer group that the offer addresses.
Products and services (objects of the Product/Service type) are placed in the cells of the first column of the business segment matrix. The target group (various organizational elements) is placed in the cells of the first row. You define the market by placing a business segment object in the cell where product row and target group column intersect. Implicit relationships of the belongs to business segment type are established between the product/service and the organizational element.
To emphasize the significance of a business segment, five different symbols are available from almost unimportant to very important.
When modeling, you need to observe that each business segment can be placed within the matrix only once.
For each business segment, you can indicate its importance in terms of the corporate strategy. A strategy describes long-term procedures that the company employs to achieve its objectives and to gain competitive edge.
The following figure shows a business segment matrix from the pharmaceutical field.
Business segments can also be assigned an objective diagram. The objective diagram contains the objectives set for the business segment as well as the processes and success factors supporting the achievement of these objectives.
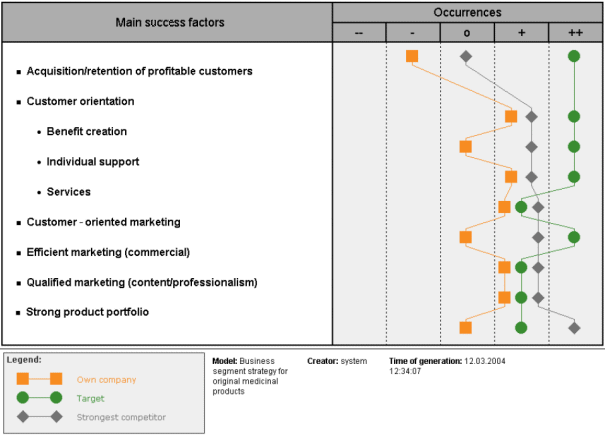
The success factors in the objective diagram can be the basis of success factor analysis if the Success - Actual, Success - Target, and Success - Competitor attributes are specified in the attribute type group of the same name. Success is evaluated by means of a five-step scale from very low to very high.
Procedures
To perform a success factor analysis,
1. use the context menu of the business segment to start ARIS report (Evaluate > Report),
2. and select the MSF_Analysis(Object).rso report script of the BPM group in the default path of the Report Wizard.
The report is output in HTML format.
Alternatively, you can start the success factor analysis via the context menu of the objective diagram. Select the MSF_Analysis(Model).rsm report script.

