Function allocation diagram (I/O)
In addition to the event control representation explained in chapter
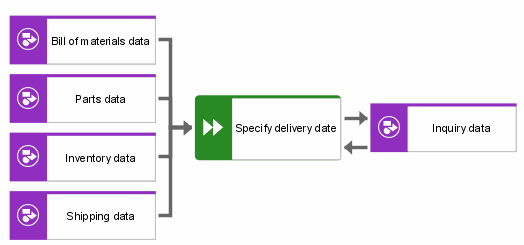
Event-driven process chain (EPC), the transformation of input data into output data and the representation of data flows between functions also form a link between the data view and the function view in the ARIS concept. The transformation of input data into output data can be illustrated in so-called Function allocation diagrams (I/O) which basically correspond to pure input/output diagrams used in other methods. The following figure illustrates an example of a function allocation diagram (I/O). The input data of the
Determine delivery date function are
Parts data,
Inventory data,
Bill of materials data, and
Shipping data.
Inquiry data serves as both input data and output data. Thus, a function allocation diagram (I/O) consists of functions of the function view and information objects of the data view. The arrows determine whether an information object is used only as input data, output data, or as input/output data. More detailed specifications are possible, indicating, for example, that the function has created or deleted an information object. Depending on the degree of detail, information objects can be Cluster/Data models, entity or relationship types, or attributes of the data view.
The example shown above illustrates the actual aim of function allocation diagrams (I/O), which is to represent a function's input/output data.
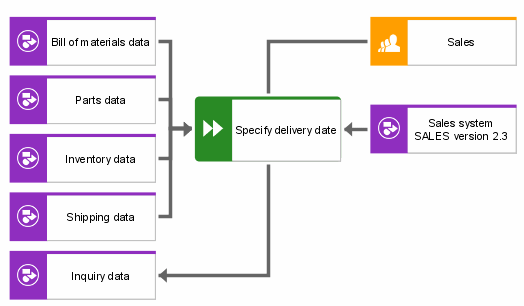
Besides a function's input/output data, events and all other objects that can be allocated to the functions in an EPC are available. Thus, the user is able to restrict the modeling of process chains in EPC diagrams to events and functions, and to assign each function a function allocation diagram (I/O) containing all additional relationships the function has. This allows for much clearer representations of business processes and also explains the use of a new name for this model type. The following figure illustrates an example of this more detailed representation in a function allocation diagram.
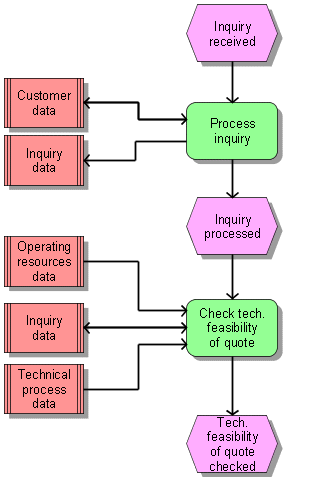
Besides this method of representing data transformation in the form of function allocation diagrams (I/O), it is also possible to include this information in an EPC. The following figure illustrates an example. In this case, the links between functions and information objects play the same role as in function allocation diagrams (I/O). However, including them in a process chain having numerous branches may result in a very complex representation.
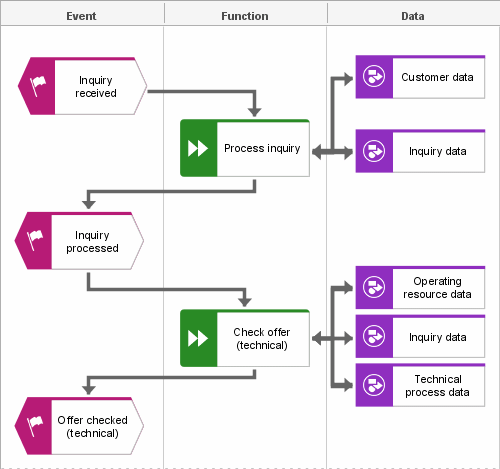
In the PCD (process chain diagram), objects have to be arranged according to the column description. The EPC representation permits free object arrangement. However, adding input/output data may result in complex and thus confusing models. Therefore, we recommend a PCD representation especially for business processes following an operational sequence. The following figure shows the EPC with input/output data of the above figure as a PCD (see also chapter
EPC/PCD).


