Displaying the Runtime Metrics
Use the following procedure to display runtime metrics for a virtualized asset.
When you view the runtime metrics, be aware that:

To view the runtime metrics of a virtualized service, it is necessary that the virtual type's definition includes the
Runtime Metrics profile.
If you do not see the
Runtime Metrics profile of a virtualized service, it is probably because you do not have “View” permission for the profile.
To display runtime metrics for an asset
1. In CentraSite Business UI, display the details page for the asset whose runtime metrics you want to view. If you need procedures for this step, see Displaying Details of an Asset. 2. Select the Runtime Metrics profile.
3. Expand the Filters node.
4. Use the following fields to filter the metrics list you want to view:
In this field... | Specify... |
Gateway | A gateway of the asset, or select All to view the metrics of all gateways to which the virtual service is deployed. CentraSite displays None by default. |
Date Range | A range of dates from which to view the metrics (e.g., Last 1 hour, Last 12 hours, Last 1 day, Last 5 days, Last 10 days, Last 20 days, Custom, and so on.). CentraSite displays Last 10 days by default. |
Start Date/End Date | If chosen Custom in the previous field, then the time period for which to view the metrics. Start Date: Click the calendar and select a starting date and time. End Date: Click the calendar and select a ending date and time. |
Display Interval | A running count metrics of the service displayed at regular time intervals. The interval is specified in the format 3m 2d 6h; wherein m indicates the month, d indicates the day and h indicates the hour. |
5. Click Refine.
CentraSite displays a graphical view of the metrics for all performance categories as shown below:
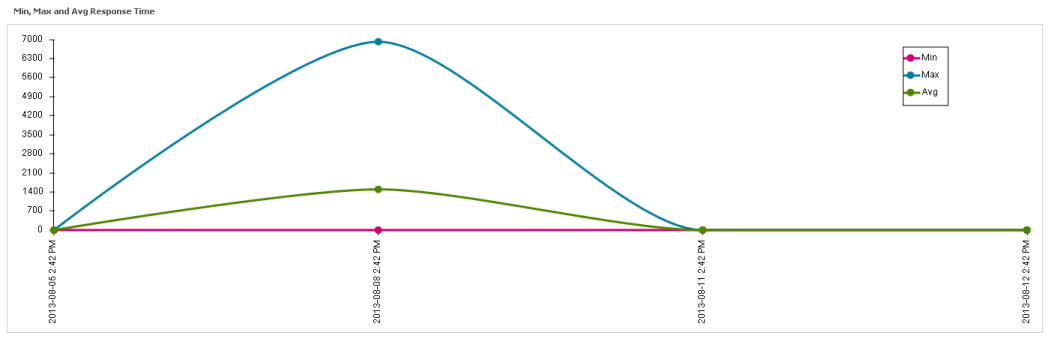
Multi-line Chart
The chart shows the Minimum Response Time, Maximum Response Time, and Average Response Time of the virtualized service.
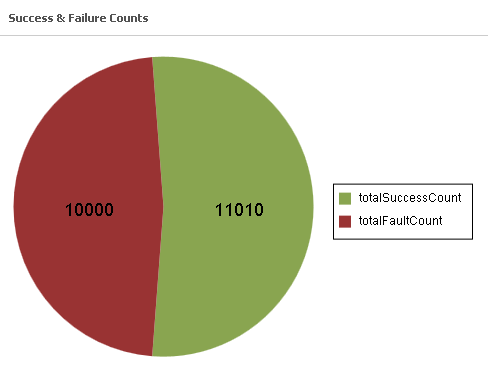
Pie Chart
The chart shows the Success Request Counts, Total Request Counts, and Fault Counts of the virtualized service.
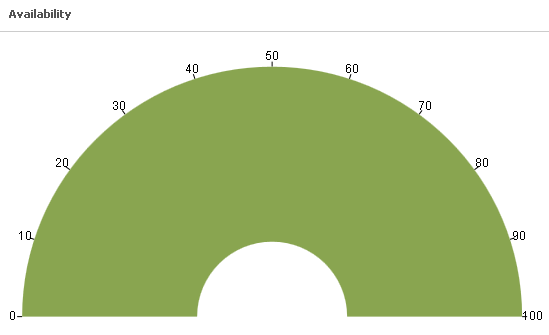
Gauge Chart
The chart shows the availability of the virtualized service.