Enterprise Summary
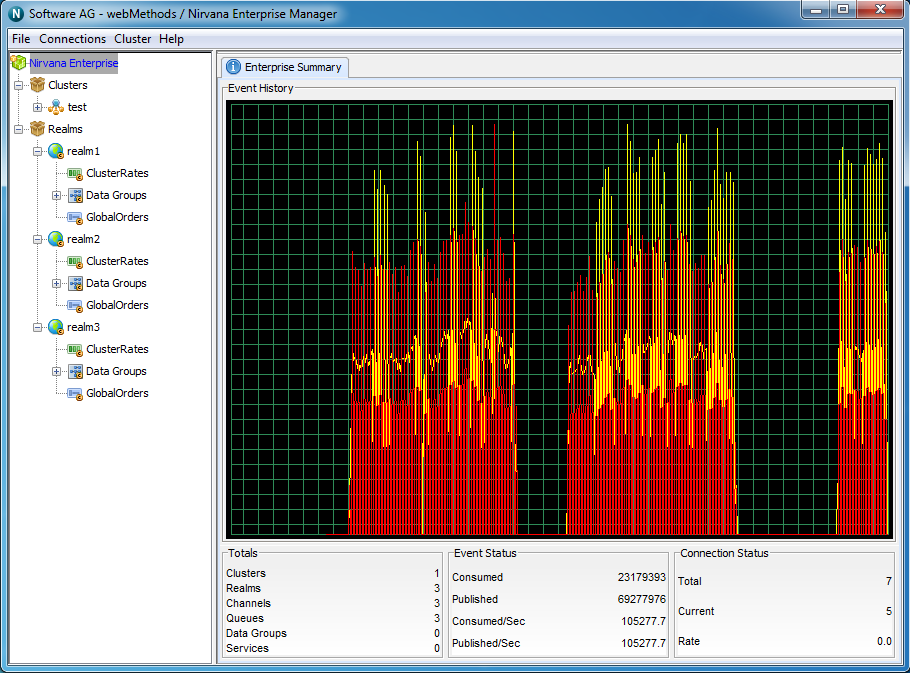
The enterprise view is the first screen you see whenever the Universal Messaging enterprise manager is launched. The screen is designed to provide an overview of the characteristics as well as current status of the set of Universal Messaging realms that enterprise manager is currently connected with
This section describes the type of status information that can be observed from the Enterprise level view.
The top of the screen displays a large real time graph illustrating the total number of events published (yellow) and consumed (red) across all Universal Messaging realms.
The bottom of the screen displays 3 panels named Totals, Event Status and Connection Status. These panels and the information displayed are described below.
Totals
The Totals section describes 5 values :
 Clusters
- The number of clusters defined within the enterprise manager and its realm nodes
 Realms
- The number of realms known by the enterprise manager
 Channels
- The number of channels that exist across all known realms
 Queues
- The number of queues that exist across all known realms
 Data Groups
- The number of Data Groups that exist across all known realms
 Services
- Total number of services that exist across all known realms
Event Status
The Event Status section describes 4 values:
 Published
 - The total number of events being published to all channels, queues and services across all realms
 Consumed
 - The total number of events being consumed from all channels, queues and services across all realms
 Published/Sec
 - The number of events being published to all channels, queues and services, per second across all realms
 Consumed/Sec
 - The number of events being consumed from all channels, queues and services, per second across all realms
Connection Status
The Connection Status section describes 3 values :
 Total
Total - The total number of connections made to all realms
 Current
 - The current number of events across all realms
 Rate
Rate - The number of connections being made per second across all realms at this point in time

