You specify the KPIs (cycle times, frequencies, costs, adherence to deadlines, and quality guidelines) to investigate, and
Process Performance Manager automatically reconstructs the entire business process in an easy-to-read, event-driven process chain view.
Process Performance Manager provides a wide selection of chart types and tables in which to display the results of your analyses clearly and in detail.
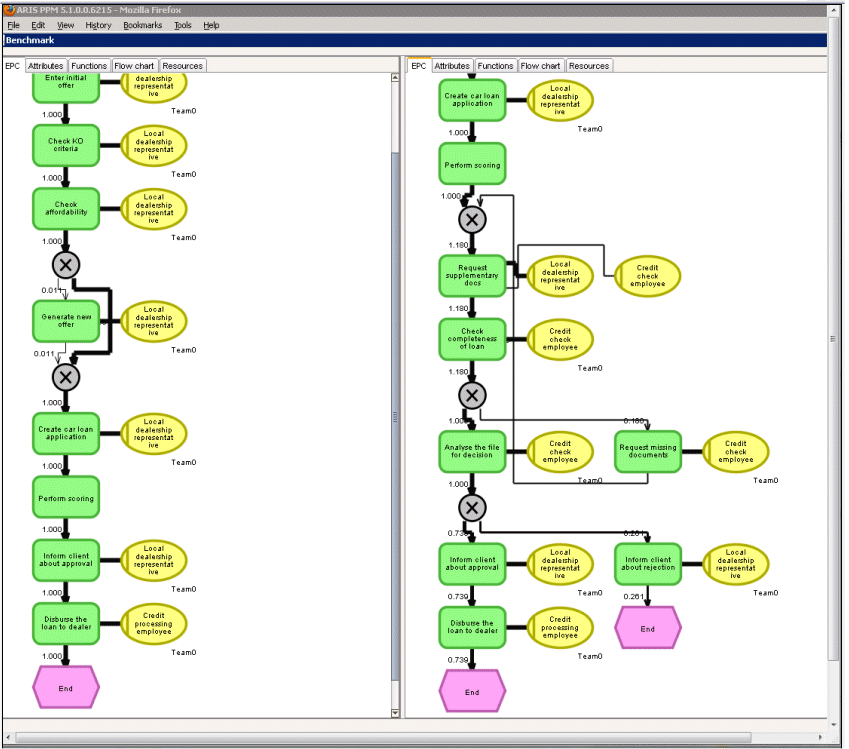
Process Performance Manager data is displayed in an Internet browser-based user interface. The illustration below shows the comparison of the aggregated fast-running processes versus the aggregated slow-running processes described in
Analytics & Decisions Example.

