Understanding the Overview Dashboard
The Overview dashboard displays performance metrics for the selected process.
Process Volume
The Process Volume panel plots the number of process instances that completed during the selected time range.
When viewing with this panel, be aware that:

The graph plots measurements from left (the first measurement in the selected time range) to right (the most recent measurement) for the selected time range.
A measurement represents the number of process instances that
completed during a given interval within the time range.
The length of an interval varies as follows according to the selected time range.
Selected range | Length of each interval |
Today | One minute (if range is less than 12 hours)One hour (if range is greater than 12 hours) |
1 hour | One minute |
1 day | One hour |
1 week | Four hours |
4 weeks | One day |
Custom | Varies according to what is most appropriate for the specified time range. |
You can display the time and exact measurement for a given data point by hovering over the point with your cursor.
The time displayed for a data point represents the end of the interval. For example, if you are viewing the graph for a
1 day time range (which reports measurements at hourly intervals), the data point at 2:00 represents the measurement for the interval 1:00:00:001 to 2:00:00:000 (inclusive).
Process Activity
The Process Activity panel reports the following metrics for the selected process:
This measurement.. | Represents... |
Running instances | The number of instances still in progress at the end of the time range. |
Completed instances | The number of instances that finished processing (successfully or not) during the time range. |
Total instances | The total number of instances that were active during the time range. (This value represents the sum of Running Instances and Completed Instances.) |
Started instances | The number of new instances of this process that began during the time range. |
This panel includes the email action, which enables you to send the alarm information to other interested parties. To use this action, click the email icon

and complete the email form.
This panel also includes the escalation action which enables you to create an escalation event. If you have a closed loop solution configured this event assigns a follow up task to the designated user. To use this action, click the escalation icon

and complete the form.
Process Alarms
The Process Alarms panel displays all error types that occurred during the selected time range. An error type represents a system-defined or user-defined condition that Optimize tracks. When the condition occurs (that is, when the condition is “true”), Optimize reports it.
Typically an error type represents a problem or an error condition you want to know about. However, error types can report positive events too. For more information about defining error types, see the “Configuring Business Processes” chapter in Administering webMethods Optimize.
This panel includes the email action, which enables you to send the alarm information to other interested parties. To use this action, click the email icon
and complete the email form.
This panel also includes the escalation action which enables you to create an escalation event. If you have a closed loop solution configured for your system, this event assigns a follow up task to the designated user. To use this action, click the escalation icon
and complete the form.
Process Cycle Time
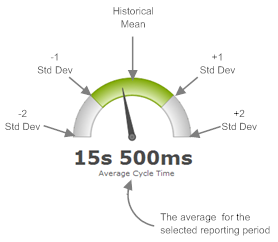
The Process Cycle Time panel displays the average cycle time for the selected time range relative to the normal cycle time for this process. This panel also reports the minimum and maximum cycle times for the time range.
Note: | Cycle time refers to the total time required for a process to run from beginning to end, including the time spent waiting to be processed and the process execution time. |
When viewing with this panel, be aware that:
The gauge represents the normal cycle-time distribution for the process. The midpoint on the gauge represents the historical mean. The marks on either side of the midpoint represent one standard deviation from the historical mean. The ends of the gauge are two standard deviations from the historical mean. (You can hover over the gauge to display the exact values.)
Note: | The gauge does not become fully functional until Optimize has collected enough performance data to produce valid baseline statistics for the process. Until then, the gauge is gray, the needle remains in the center position, and the “normal” statistics are absent from the tool tip that displays when you hover over the gauge. |
The needle position represents the average cycle time for the process instances that completed during the selected time range.
Note: | Process instances in the canceled or suspended state do not contribute to the cycle-time measurement. If a suspended process resumes and completes successfully, it will contribute to the cycle time less the time spent suspended. |
If the average cycle time is in the normal range (that is, within one standard deviation of the historical mean for this process), the center segment of the gauge displays in green. If the average cycle time moves beyond the normal range, the segment beneath the needle turns orange.
When the needle moves to the very end of the gauge, it indicates that the average cycle time is at or beyond two standard deviations from normal.
This panel includes the email action, which enables you to send the alarm information to other interested parties. To use this action, click the email icon
and complete the email form.
This panel also includes the escalation action which enables you to create an escalation event. If you have a closed loop solution configured for your system, this event assigns a follow up task to the designated user. To use this action, click the escalation icon
and complete the form.
Stage Activity
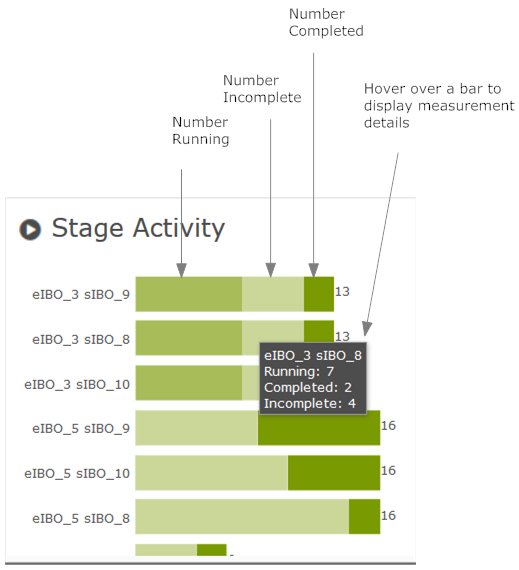
The Stage Activity panel lists the stages associated with the process and, for each stage, reports the number of running, incomplete, and completed instances.
Note: | A stage is a sequence of process steps that you want to monitor as a unit. You identify stages when you define your process model. For additional information about defining stages in a process, see the section on working with stages in webMethods BPM Process Development Help. |
This count... | Represents... |
Running | The number of stage instances that were still in progress at the end of the time range. |
Incomplete | The number of stage instances that were started but not completed during the time range. Note that, in some cases, processes can be complete even though particular stage instances do not complete. This can occur because a process may step through the first milestone of a stage, but take a branch that does not lead to the stage's end milestone. A process may also end prematurely, due to various reasons which would prevent the stage's end milestone from being encountered. |
Completed | The number of stage instances that finished processing (successfully or not) during the time range. Note: | This count will include any stage instances that Optimize marked as complete because the parent process completed before the stage instance did. This can happen, for example, when the parent process takes a path that does not include the end of the stage. |
|
When viewing this panel, be aware that:
You can hover over a bar in the graph to display the exact number of running and completed instances for the stage.
You can use the buttons at the bottom of the graph to hide or show the segments in the bar graph.
This panel includes the email action, which enables you to send the alarm information to other interested parties. To use this action, click the email icon
and complete the email form.
This panel also includes the escalation action which enables you to create an escalation event. If you have a closed loop solution configured for your system, this event assigns a follow up task to the designated user. To use this action, click the escalation icon
and complete the form.
Stage Alarms
The Stage Alarms panel reports the number of breaches that occurred during the selected time range by stage.
Note: | A breach represents a violation of a condition that is specified for the stage. For example, a condition might specify that a given stage is expected to run in less than 5 minutes. If the stage takes longer than specified, the stage is breached. For more information about specifying the conditions for a stage, see webMethods BPM Process Development Help. |
This panel includes the email action, which enables you to send the alarm information to other interested parties. To use this action, click the email icon
and complete the email form.
This panel also includes the escalation action which enables you to create an escalation event. If you have a closed loop solution configured for your system, this event assigns a follow up task to the designated user. To use this action, click the escalation icon
and complete the form.
Stage Cycle Times
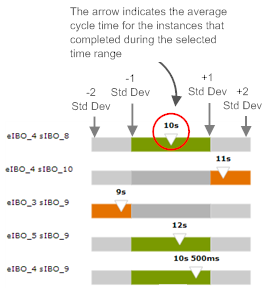
The Stage Cycle Times panel shows the average cycle time for each stage during the selected time range relative to the normal cycle time for the stage.
Note: | Cycle time refers to the time from the beginning of a stage instance to the end of the instance. |
When viewing this panel, be aware that:
The bar represents the normal cycle-time distribution for the stage. The midpoint on the bar represents the historical mean for the stage. The marks on either side of the midpoint represent one standard deviation from the historical mean. The ends of the bar are two standard deviations from the historical mean. You can hover over the arrow to display the exact values for these statistics.
The arrow position represents the average cycle time for the stage instances that completed during the selected time range.
Note: | Stage instances that have been marked complete because their parent process ended prior to the completion of the stage do not contribute to the cycle-time measurement. |
The position of the arrow and the color of the bar indicate whether the average cycle time for the selected time range is within the normal range.
| The bar is green when the average cycle time is within one standard deviation of the historical mean. |
| The bar turns orange when the average cycle time is beyond one standard deviation from the historical mean. |
| The arrow turns red when the average cycle time is beyond two standard deviations from the historical mean. |
A graph for a given stage does not become fully functional until
Optimize has collected enough performance data to produce valid baseline statistics for that stage. Until then, the graph is gray, the arrow remains in the center position of the bar, and the “normal” statistics are absent from the tool tip that displays when you hover over the arrow.
This panel includes the email action, which enables you to send the alarm information to other interested parties. To use this action, click the email icon
and complete the email form.
This panel also includes the escalation action which enables you to create an escalation event. If you have a closed loop solution configured for your system, this event assigns a follow up task to the designated user. To use this action, click the escalation icon
and complete the form.