The Business Process Dashboards
The Business Process dashboards display summary metrics, instance detail, and other performance information about business processes that are under analysis by Optimize. These dashboards are displayed in either My webMethods or the webMethods Business Console, though they are rendered by an application that runs on the MashZone NextGen Server, and you must have licensed copy of MashZone NextGen installed to use them.
For authorized users who have access to My webMethods but not the Business Console, the dashboards are accessible through the My webMethods left hand menu. For users who have access to the Business Console, the dashboards can be viewed within that interface.
There are two primary dashboard use case scenarios as described below.

For authorized users who have access to
My webMethods, including the
Optimize Analytic engine, dashboards can be used to view business process data. In this scenario, the dashboards enable users to view process metrics, and can generate Email notifications or Escalation events, but there is no infrastructure to create a closed loop process that creates and assigns tasks related to Escalation events, unless users create a custom solution to implement such functionality.
Authorized users who have purchased and installed the appropriate
Software AG components can take advantage of a true closed loop solution that allows them to view process information with the dashboards and create escalation events and tasks in context of other event enabled applications to create a true closed loop solution. Using this type of solution, dashboard users can create escalation actions assigned to other users based on issues observed on the dashboards. Tasks are assigned to the users based on the escalation action to ensure that the responsible party can observer the situation as noted when the escalation action was created and take an appropriate action.
For both use case scenarios, the list of available dashboards is as follows.
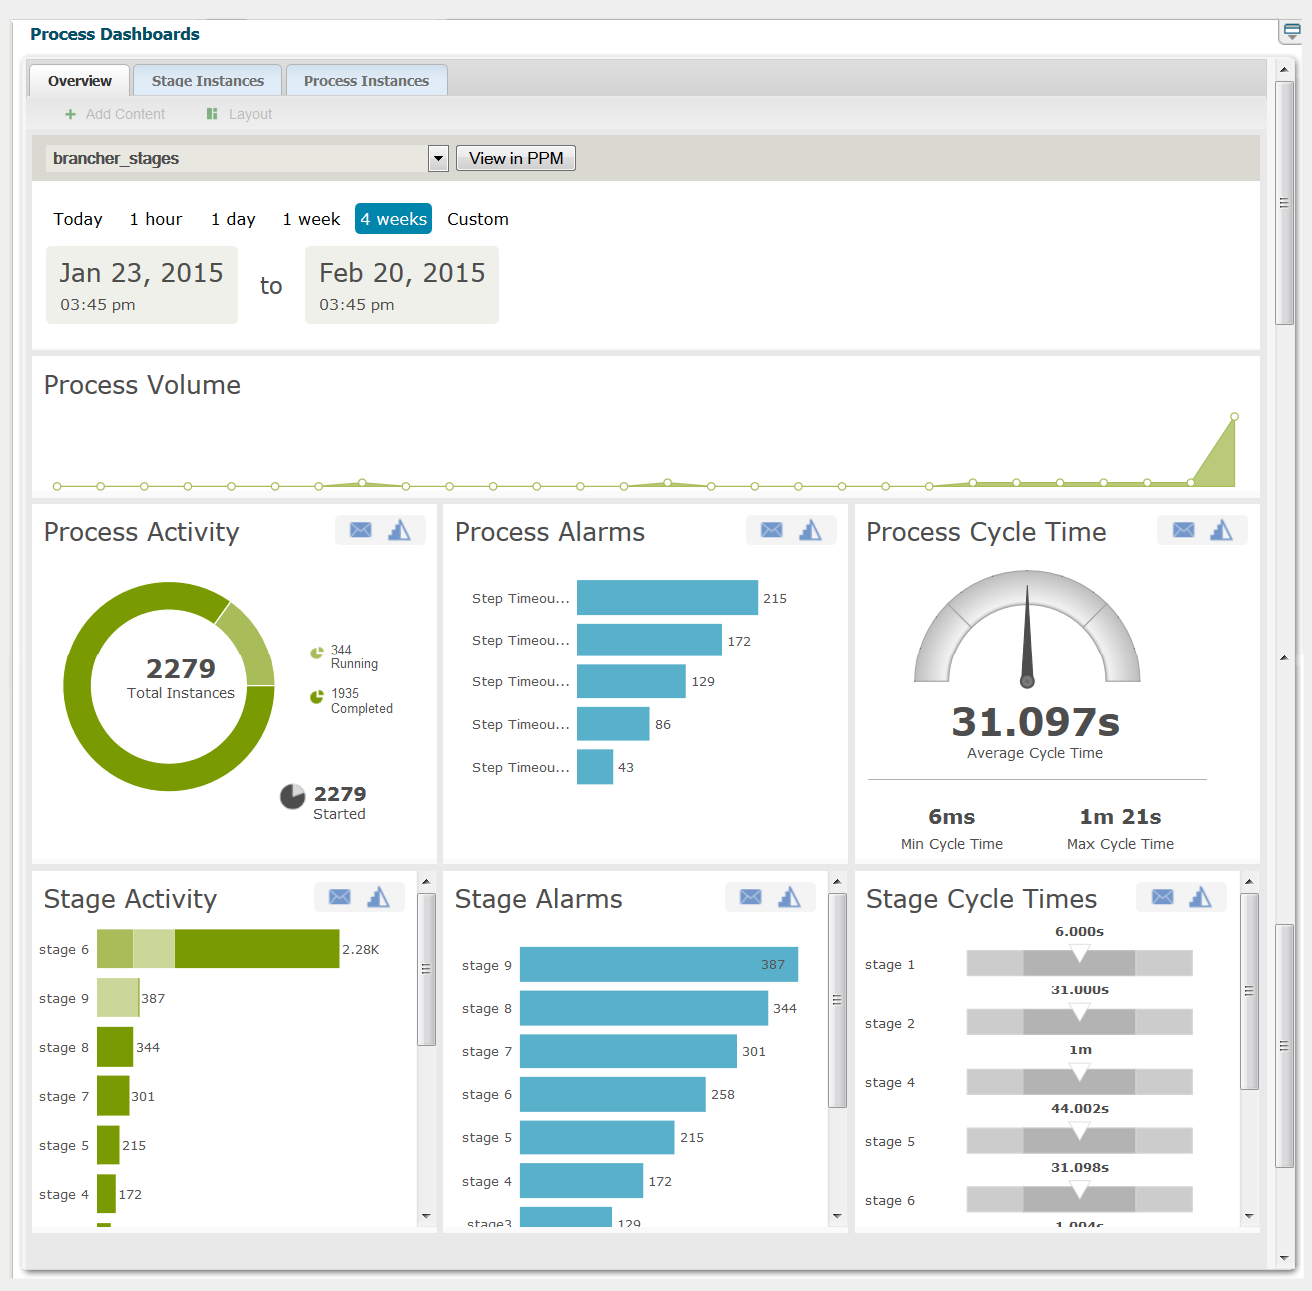
Process Overview Dashboard - This dashboard provides high-level information about a selected process including intrinsic metrics, historical views, and normality comparisons across a specified time range. This dashboard helps users to quickly identify potential issues, obtain information about alarms and stage activity, and use email or escalation actions to share findings with others.
Stage Instances Dashboard - This dashboard shows stage activity and performance for a process across a specified time range. The top of the page shows metrics about each stage, including information about activity, cycle time, and alarms. Selecting one or more table rows reveals information about individual stage instances and enables users to send email notifications or escalation actions for individual stage instances.
Process Instances Dashboard - This dashboard shows process activity and performance across a specified time range. A chart at the top of the page displays historical information about process volume activity and cycle time performance. A table at the bottom of the page shows individual process instances and enables users to send email notification or escalation actions for individual process instances.
For systems that include Software AG Process Performance Manager, the View PPM button on the dashboards will open Process Performance Manager in a new browser tab, with the context of the process model that was selected in the dashboards. If Process Performance Manager has not been configured, the button will be disabled and a tool tip will instruct you to contact a My webMethods Server administrator.