When you connect to the server, you are able to see in the Administrator details of all the sessions currently running on the server. To view the sessions on the server, open ApplinX Administrator and expand the node. The Main view pane on the right will display the session's details:
The ID of the session.
U0000001
The session's description, for example, User ID on the host or IP address.
The name of the application the session relates to.
CompositeDemo
Workstation ID/LU Name, available only in certain protocols.
The amount of time the session has been in its current state.
14:30
Current status of the connection pool. Can be "Not Started", "Initializing", "Active", "In standby", "Suspended", "Stopping" or "Stopped".
Active
The name of the connection pool.
/<connection pool name>
The type of session currently running: Web Enablement, SOA, or Development session (Designer)
The status bar shows the total number of sessions currently running, and in parenthesis, the number of active sessions.
To view a specific session's properties, open ApplinX Administrator, right-click the specific session in the Main view and select . The Session dialog box appears including the following information:
The session's ID on the ApplinX server.
The IP address from where the session is connected to ApplinX.
The session's description. For example, this may be the session's computer address.
The IP address of the host.
Workstation ID/LU name, available only in certain protocols.
The name of the application on ApplinX server to which this session is connected.
The GCT file name that is to work with this session and the screen number in the GCT file.
The name of the trace file that is tracing the current session.
The number of bytes sent to the host.
The number of bytes received from the host.
The time period in which a session has not performed a communication activity with the host.
The number of communication activities the session has made with the host.
The current communication status between ApplinX server and the host. Can be either: "Idle" (connected, not attached), "Initializing", "Processing" (executing an action), "Active" (attached), or "Disconnecting".
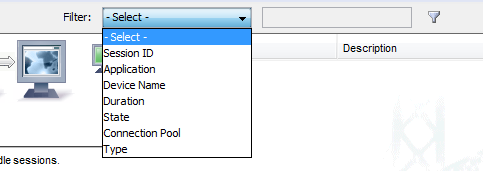
You can filter the displayed sessions in the ApplinX Administrator by
Session ID
Application
Device Name
Duration
State
Connection Pool
Type
See screen below:
Two types of filtering are supported:
Fot the Duration column, you can enter values in format "x day(s)", "hh:mm:ss" or value in seconds.
You can also use less than/greater than signs: "<" / ">", for example
"> 3 days" (greater than three days)
"< 00:05:00" (less than five minutes)
For all other columns, the check is based on the string itself. You can use "*" as wildcard to replace 0 or more characters, or use "!=" or "not". Examples:
"U00*"
"not U*"
"!=U*"
Define a filter and press or click the Filter button to activate the filter. The filter specification appears near the table in the node information area.
When a valid filter is properly applied, the background color of the filter area is colored light orange:
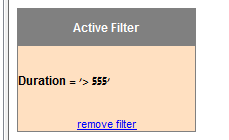
If you are filtering by duration, the filter is validated. If it does not match one of the allowed formats ("x day(s)", "hh:mm:ss" or value in seconds) a red border is created around the text field, indicating the value is not allowed.

When you modify active filter, the color changes back to indicate that the filter line and active filter box are not the same.
 To remove the filter
Click the blue "remove filter" link.
Or:
Choose the defaulted "Select" option from the filter type combo box.
Or:
Remove the value from the text field and press or filter button.
By default, the session list is sampled every second in order to keep it updated. When many users connect to the server, this refresh rate can significantly slow down the list's update. You can change the system's refresh rate to suit your needs.
To set the Refresh Rate
Open ApplinX Administrator.
Right-click on the Management>Current Activity>Sessions node and select Refresh Rate. The Refresh Rate dialog box appears.
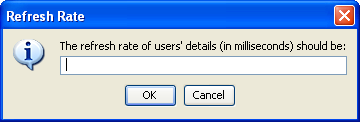
Type the new Refresh Rate in milliseconds, click .
The Refresh Rate is changed, and you may read all updated data from the server in the desired frequency.
This feature allows you to view the current host session while you are in the Administrator. The benefits of this feature are that it allows you to view the current host screen at the same time as other users are viewing the same host screen. If you are experiencing problems in code, the Session Viewer allows you to view the current host screen.
To access the Session Viewer, open ApplinX Administrator and select the relevant session in the Main View, then either right-click on the session and select or select in the menu.
Using the Administrator, you can cancel a session from the server. This is useful when:
A session is "stuck" and is unable to perform any activity.
An unauthorized session has logged on.
A session remains idle for a long time, and a "non-activity" timeout has not been defined.
Note:
You can use session filtering to cancel multiple sessions in one operation. See Filtering your Session above.
To cancel a session on the server
Open ApplinX Administrator.
Select the relevant session in the Main View, then either right-click on the session and select or select in the menu.
Click in the Cancel Session dialog box appears.
Note:
Refer to the Administrative Web Services API to access connection
pool information using the API.
To view a list of all Pools whose applications are loaded open ApplinX Administrator and select the node.
The name of the application followed by the full name of the Connection Pool.
Demo:/folderA /ConnectionPoolName
Current status of the connection pool:
"Not Started"- The connection pool was not initialized yet. If a user requests a connection the connection pool will return an immediate error.
"Initializing" - The connection pool is trying to reach Active status, but does not have any ready connection yet. If a user requests a connection the connection pool will return an immediate error.
"Active" - The connection pool is working, and managed to create at least one connection to the host.
"In standby" - The connection pool had several consecutive errors trying to create new connections to the host. The connection pool will continue to try to connect if user requests arrive, but will not initiate new connections otherwise. If a new connection is successfully created, the status will automatically change to Active.
"Suspended" - The connection pool is blocked for new users, and does not maintain its connections. If a user requests a connection the connection pool will return an immediate error.
"Stopping" - The connection pool is trying to reach Stopped status, but still has connections in different stages of termination. When all connections are down, the status will automatically change to Stopped. If a user requests a connection the connection pool will return an immediate error.
"Stopped" - The connection pool does not have connections or maintenance. If a user requests a connection the connection pool will return an immediate error.
The number of connections in use (with users attached).
10
The number of available connections.
5
The number of connections currently in one of the following states: initializing, recycling or keep-alive.
1
To view the run time information about a specific connection pool, open ApplinX Administrator and select thenode and then either double-click the required connection pool in the Main view area or right-click the required connection pool either in the ApplinX Explorer or in the Main view section and select.
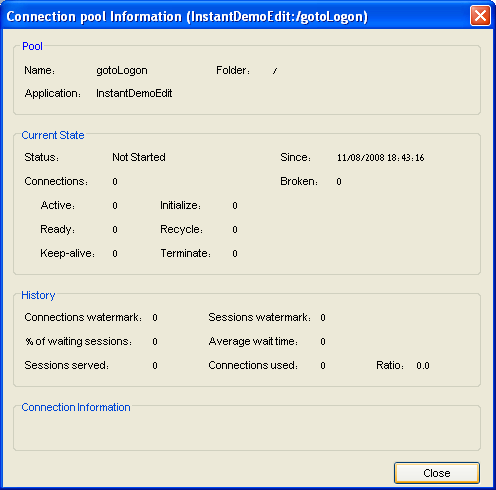
This panel displays identifying information about the displayed connection pool.
The name of the displayed connection pool.
The folder in which the displayed connection pool is placed.
The application to which the connection pool belongs.
This panel displays run time information about the displayed connection pool.
The connection pool's status: "Not Started, Initializing, Active, In standby, Suspended, Stopping "or "Stopped".
The connection pool is in its current status since this time.
The total number of connections in the connection pool, ignoring broken connections.
The number of connections that failed initialization recently. When more than 0, this number is shown in red.
The number of connections currently held by a session (user).
The number of connections ready for use.
The number of connections currently performing keep-alive activity.
The number of connections currently performing initialization activity.
The number of connections currently performing recycling activity.
The number of connections currently performing termination activity.
This panel displays accumulative information about the displayed connection pool. The information in this panel is reset when the connection pool is stopped.
The maximum number of concurrent connections in this connection pool.
The maximum number of sessions that used this connection pool concurrently.
The percent of sessions that did not immediately get a connection when trying to connect to ApplinX.
The average time (in milliseconds) sessions waited for a READY connection (calculated only among those sessions that waited) multiplied by the percentage of waiting sessions. For example: if 8% sessions had to wait, and in average each of those waited 1000 milliseconds, the overall average wait time was: 0.08 * 1000 = 80 milliseconds.
The total number of sessions that connected to the connection pool since the connection pool started.
The total number of different host connections created by this connection pool.
Sessions served divided by Connections used. This parameter can give a general indication of how much connection recycling is effective. A large ratio means that a relatively small number of connections served a large number of sessions.
This panel displays the name of the Information Set that the displayed connection pool uses. If this panel is empty, no Information set is used.
The name of the information set used by this connection pool.
To view a list of all the connections of a particular connection pool, open ApplinX Administrator and select the node and in the ApplinX Explorer area select the required connection pool.
The connection identification number (unique in the contexts of this connection pool)
6
Current status of the connection. Can be "Active", "Ready", "Initializing", "Keep-alive", "Recycle" or "Terminating".
Active
This column is relevant only for active connections. The Session ID of the user that holds this connection.
U0000014
The time that passed since the connection is in its current status.
00:03:24
Relevant only for broken connections. A message that may imply on the reason this connection became corrupt.
To cancel a connection, open ApplinX Administrator and expand the node. Right-click on a connection and select .
Note:
Active connections can also be cancelled by canceling their user
through the Sessions node.
To modify the activity status of a connection pool, open ApplinX Administrator and expand the node. Select one or more connections you want to control, right-click and select one of the options detailed below:
Note:
The available options will vary according to the current status of
the selected connection pool(s).
| Name | Description |
|---|---|
| Start Connection Pool | A connection pool that has not been started or a stopped connection pool will reload its configuration, initialize a new pool and start the connection pool operation. During the activation of the pool, until at least one connection is ready, the connection pool is in Initializing status. When the Start connection pool option is used on a suspended connection pool, it will simply resume operation. |
| Suspend Connection Pool | Relevant only for active connection pools. Will stop creating new connections and connection pools for new requests, but will not close the existing connections in the pool. |
| Resume Connection Pool | Resumes the possibility to use a suspended connection pool of the application |
| Stop Connection Pool | Stop providing connection pool and close all connections in the pool. During this process, the connection pool enters Stopping status, until all connections are closed. Then the connection pool becomes Stopped. Reactivation will reload the connection pool configuration. |
| Restart Connection Pool | Stop the connection pool. After it reaches Stopped status, start the connection pool again. |
To view a form that displays the run time information about a specific connection of a connection pool, open ApplinX Administrator and click on the node and select a connection pool. Right-click the required connection in the Main view section and select . The Connection Information dialog box which displays run time information about a specific connection of a connection pool appears.
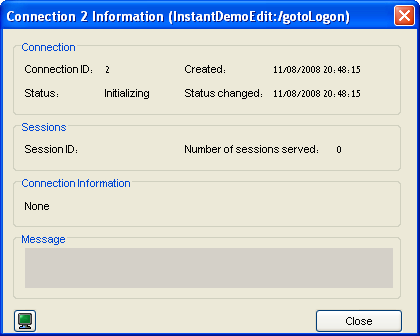
The Identifier of the displayed connection.
Creation time of this connection.
The current status of the connection. One of:" Active/ Ready/ Initializing/ Recycling/ Keep-alive/ Terminating/ Broken".
The time of the last change of the connection's status.
Active connections only - displays the ID of the session holding the displayed connection.
The number of sessions this specific connection served so far.
If a Connection Information set is used by this connection pool, this is the ID of the specific record used by the displayed connection.
Displays error messages for broken connections.