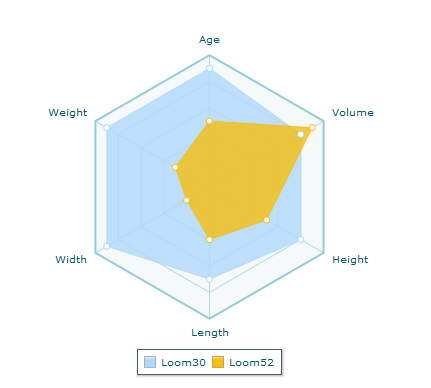
webMethods and Intelligent Business Operations 10.2 | Integrate Software AG Products Using Digital Event Services | MashZone NextGen Help | Appendix | Legacy Presto components | Mashables and Mashups | Views for Mashups and Mashables | Built-in MashZone NextGen Views | Radar Chart
 
Radar Chart
Radar charts display irregular polygons plotted from a shared center with each polygon point representing the magnitude of a dimension of one item. Radar charts facilitate easy comparison of multiple dimensions for dataset rows. This is also sometimes called a spider chart.

Copyright © 2018 | Software AG, Darmstadt, Germany and/or Software AG USA, Inc., Reston, VA, USA, and/or its subsidiaries and/or its affiliates and/or their licensors.
Innovation Release