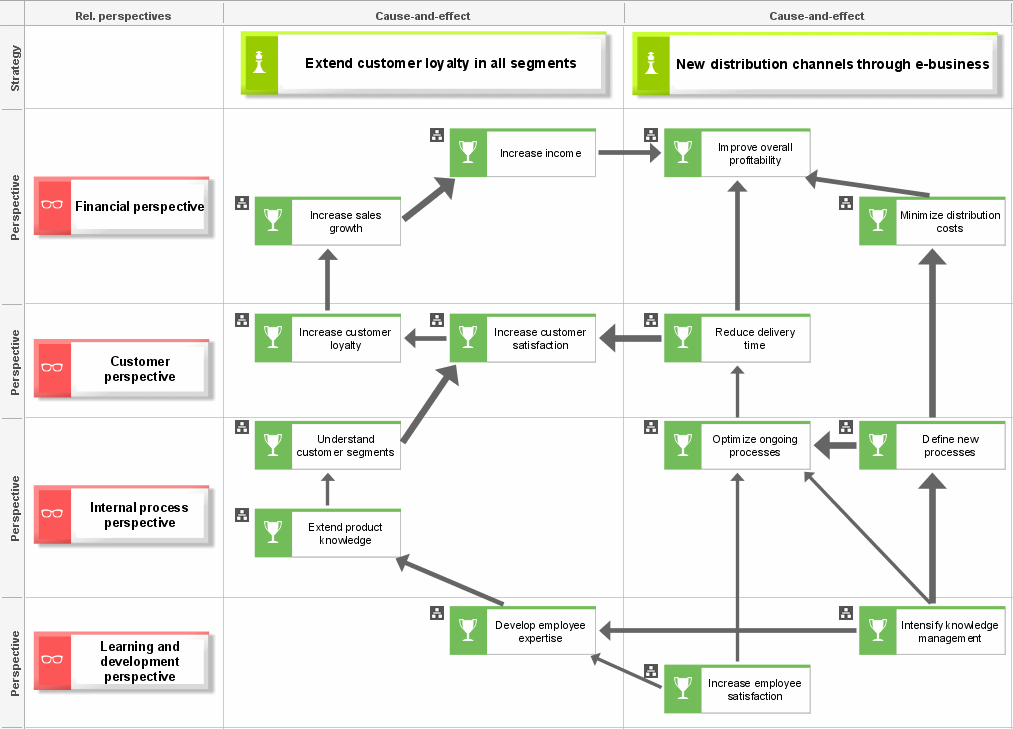
Cause-and-effect relationship specification
The objects of the organizational chart and the functions or structural elements of the structuring model, which determine the company-wide structure of the Balanced Scorecard, are assigned BSC cause-and-effect diagrams.
In the BSC cause-and-effect diagrams, the strategic objectives and success factors required for successful strategy implementation are defined, and their mutual influence is illustrated by means of the various Balanced Scorecard perspectives. First, the individual perspectives used in all cause-and-effect chains of the company are created as objects in ARIS.
The BSC cause-and-effect diagram is a lane model which allows the Perspective object types to be stored in the Relevant perspectives column and the Strategy object types to be stored in the Strategy row. The Objective, Success factor, and KPI object types can be modeled in the cause-and-effect columns. The degree of effectiveness of the strategic objectives and their success factors are described in the cause-and-effect column. The greater the effectiveness, the thicker the arrow that represents it.
Furthermore, success factors for a Balanced Scorecard can be defined in the BSC cause-and-effect diagram. By using the Success factors object type, you can include other factors on which the company has no direct influence and their KPIs in the Balanced Scorecard (for example, market growth).
The BSC cause-and-effect diagram can be found at the requirements definition level of the control view.
The Objective and Success factor object types in the modeling column of the BSC cause-and-effect diagram can be assigned a BSC KPI allocation diagram only.
The following symbols are used in the BSC cause-and-effect diagram:
Symbol | Object type |
| Perspective |
| Strategy |
| Objective |
| Success factor |
| KPI instance |


