CD diagram
The CD diagram (cost driver diagram) is used in process cost management (for example, with ARIS Optimizer). The CD diagram represents the cost driver hierarchy.
A cost driver is an informative indicator or reference value for estimating the costs of a specific process. The reference value should be an operational value that can be easily derived from available information sources and is proportional to accruing costs.
Therefore, cost drivers can be defined only for performance amount-variable or performance amount-induced processes. Cost drivers cannot be defined for performance amount-neutral processes, for example, Manage department. An example of a cost driver is Length of a street for the Blacktopping a street process.
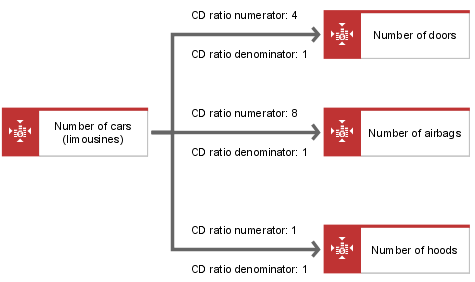
The hierarchy of cost drivers is represented in the CD diagram by directed connections of the determines volume of type. The CD ratio numerator and CD ratio denominator attributes must be specified for these connections. If CD ratio denominator is not specified, a value of 1 is assumed. The quotient of these two attributes determines the quantity ratio between the two cost drivers for process calculation.
The example in the following figure shows two cost drivers: Number of cars (limousines) and Number of doors. To show that each limousine has four doors, the CD ratio numerator attribute must be set to 4 at the connection linking the Number of cars (limousines) cost driver with the Number of doors cost driver.
The cost drivers are allocated to individual processes in the process view tables. The usage factor for each function in the processes can be determined automatically via the cost driver hierarchy.

