This document covers the following Command Central topics that are specific to EntireX:
Note:
Command Central functionality that is not EntireX-specific is described in the separate Command Central documentation or the
online help provided with Command Central. On Empower, the documentation is provided under
webmethods > EntireX > EntireX 10.1 > Additional Documentation.
Software AG Command Central is a tool that release managers, infrastructure engineers, system administrators, and operators can use to perform administrative tasks from a single location. Command Central can assist with the following configuration, management, and monitoring tasks:
Infrastructure engineers can see at a glance which products and fixes are installed, where they are installed, and compare installations to find discrepancies.
System administrators can configure environments by using a single web user interface or command-line tool. Maintenance involves minimum effort and risk.
Release managers can prepare and deploy changes to multiple servers using command-line scripting for simpler, safer lifecycle management.
Operators can monitor server status and health, as well as start and stop servers from a single location. They can also configure alerts to be sent to them in case of unplanned outages.
Note:
Command Central is available for Broker instances running on UNIX and Windows platforms.
For EntireX, you can use Command Central to perform the following operations on EntireX Broker:
View the number of EntireX Brokers running in each environment of your IT landscape
View the versions of EntireX Brokers
Monitor EntireX Broker installations
Monitor runtime status, KPIs (key performance indicators), and alerts of EntireX Broker instances
Start, stop, and restart EntireX Broker
Configure the following parameters of EntireX Broker:
Application Monitoring
Attribute File
Autostart
Monitoring KPIs
Persistent Store
SSL Ports
TCP Ports
Security
Trace
Enable and specify EntireX Broker Trace Level temporarily
Display Services
Stop Service
Display Server Instances of a Service
Stop Server Instance
Create new EntireX Brokers
Delete existing EntireX Brokers
Note:
Software AG Platform Manager (installed by default with Command Central) uses
EntireX Broker Admin to obtain information about EntireX Brokers, so EntireX Broker Admin must be
running if you want to administer EntireX Brokers through Command Central.
For more information see the separate Command Central documentation or the online help provided with Command Central.
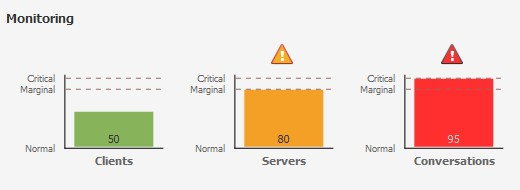
The visual key performance indicators (KPIs) and alerts enable you to monitor webMethods EntireX Broker's health. The following KPIs help you administer, troubleshoot, and resolve performance issues in EntireX Broker:

| KPI | Description |
|---|---|
| Clients | Number of active clients. |
| Servers | Number of active servers. |
| Conversations | Number of active conversations. |
The EntireX Broker component supports the configuration instances listed in the following table.
| Instance | Type | Use to... |
|---|---|---|
| APPLICATION-MONITORING | APPLICATION-MONITORING | Configure Application Monitoring. |
| ATTRIBUTE-FILE | ATTRIBUTE-FILE | Show and edit the EntireX Broker Attribute file. |
| BROKER-AUTOSTART | BROKER-AUTOSTART | The autostart value of an EntireX Broker instance determines whether it will be started when the computer is restarted. |
| SSL | BROKER-PORTS | Show and edit the EntireX Broker SSL Transport parameters. |
| TCP | BROKER-PORTS | Show and edit the EntireX Broker TCP Transport parameters. |
| BROKER-PSTORE | BROKER-PSTORE | Define how unit-of-work messages are stored to disk. |
| BROKER-SECURITY | BROKER-SECURITY | Enable or disable EntireX Broker security. |
| BROKER-TRACELEVEL | BROKER-TRACELEVEL | Show and edit the EntireX Broker Trace Level. |
| MONITORING-KPI | MONITORING-KPI | Show and edit the Monitoring KPI settings, like the marginal and critical bounds, etc. |
Note:
The default SSL Port configuration uses default certificates provided with the installation, but we strongly recommend you
create your own. This means, however, that you may provide an incorrect certificate in the Command Central graphical user
interface.
This has the effect that the Monitoring KPIs are not presented correctly and the original communication exception cannot be
shown in the GUI.
However, the original exception is available in the wrapper.log of the SPM profile.
Look for the string pattern "cannot get KPIs! RpcException 0013" in the log file and check the EntireX Error Messages and Codes for the original RpcException.