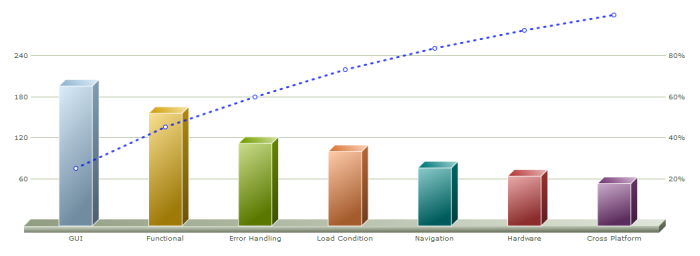
Pareto Chart
Pareto charts show both the values for a single numeric dimension over a set of categories and the relative contribution of each to the sum total. This combination provides an easy 80/20 view to identify key causes or factors and ordered from largest to smallest. Values display as ordered columns, from largest to smallest, while the relative contribution appears as a line.