Using Phoney to Monitor an Application’s Memory and Thread Usage
You can use Phoney to run applications on a simulated, generic device. When using Phoney to run an application, you can view memory and thread usage information for the simulated device in the Metrics panel. Use the metrics to determine:

Estimation of how much memory and threads an application uses.
When an application’s memory and thread use is at its highest.
The metrics can help determine whether you might encounter issues with memory and thread usage when running the application on physical devices.
Additionally, Phoney displays warnings if an application’s memory and/or thread use exceeds configured thresholds.
Note: | When running the application on a physical device, the metrics might differ somewhat from the values in the Metrics panel. For example, when running the application on a physical device, the memory usage might be a little less because the format of the application resources, such as, data, images, and sound, might be in a format better suited for the physical device. Native Mobile Designer libraries used on physical devices might also differ slightly in their usage of threads. Also note that other applications accessing sound and video hardware can cause the JVM in which Phoney is running to create spurious threads. For example, web browsers displaying video, Flash, or other rich content might cause the JVM in which Phoney is running to create spurious threads. You can safely ignore these additional threads. |
Metrics Panel
You can open the Metrics panel from Phoney by selecting Phoney > App Metrics, or by pressing CTRL+M on the keyboard. The Metrics panel displays the following information:
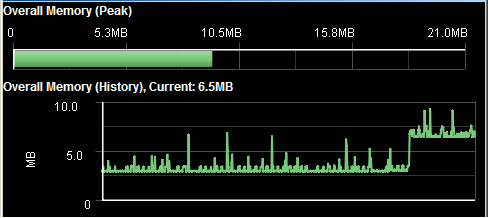
Overall memory usage of an application The Peak bar shows the highest recorded use of memory, as a proportion of the current JVM's total size. The History graph shows the last 60 seconds of memory usage.
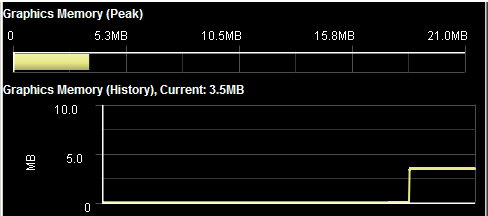
Memory usage for Image classes within an application Similar to the overall memory metrics, these metrics display a Peak bar that shows the highest recorded use of memory for Image classes within the application. The History graph shows the last 60 seconds of memory usage.
Because both the overall memory usage and the usage for Image classes use the same scale, you can determine the proportion of the overall memory that the application uses for Image classes.
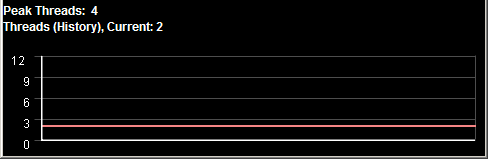
Thread usage For thread usage, the Metrics panel lists the number of threads that the application has created. The History graph shows the last 60 seconds of thread usage.
Note: | Even if the Metrics panel is closed, Phoney continues to monitor memory and thread usage and displays warnings if memory and/or threshold use exceeds configured thresholds. |
Setting Warning Thresholds and How Warnings are Displayed
You can configure limits for when you want Phoney to signal a warning if an application's memory and/or thread usage is approaching or exceeding configured limits. To configure the limits, you specify options when you start Phoney. If you do not specify the startup options, Phoney uses default values. You can specify the startup options:
On the command line when you start Phoney.
When starting Phoney via
Software AG Designer. Set the options in one of the following locations:
On the
Arguments tab inside the Run Configurations window.
When an application goes over the configured limits, Phoney displays a blinking icon on the bottom-left of the screen. If the Metrics Panel is open, the background behind the graphs also blinks red. The warnings blink for approximately 60 seconds after the application's memory and/or thread usage reduces to the configured limits.
Note: | Even if the Metrics panel is closed, Phoney monitors memory and thread usage and displays warning icons. |
The following table lists the startup option you use to configure the limits, the default values for the limits, and provides information about when Phoney displays warning.
Memory limit | Startup option | {--metrics_mem_limit_kb | -mm} |
| Default value | 50 MB |
| Warning | Blinking RAM warning icon When blinking slowly, the application's usage is over 90% of the memory limit. When blinking rapidly, the application's usage is over the memory limit. |
Thread limit | Startup option | {--metrics_thread_limit | -mt} |
| Default value | 15 threads |
| Warning | Blinking CPU warning icon When blinking slowly, the application's usage is over 80% of the thread limit. When blinking rapidly, the application's usage is over the thread limit. |
The following example shows startup options to set the memory usage limit to 20 MB and the thread usage limit to 5 threads.
--metrics_thread_limit 5 --metrics_mem_limit_kb 20480
Alternatively, you can use the short form of the options:
--mt 5 --mm 20480