
Having access to data about the status of a database is important for a number of reasons. These include:
Monitoring for certain events (shortage of disk space or alerted jobs)
Database tuning
General overview of database status at any given moment in time
The Tamino Manager can display the following information about a database:
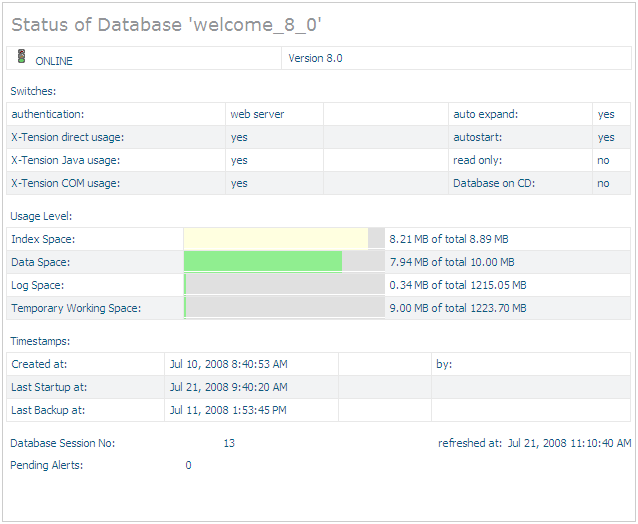
This displays general information about the database, including whether the database is online or offline, the settings of the most important switches, the usage levels of the important database spaces, time stamp information, the current session number and, where appropriate, the number of alerts pending for the database in question.
![]() To display database status information
To display database status information
Expand the Databases object and select the database for which status information is to be displayed. The Status of Database page appears.
This display includes information about buffer pool size and usage, the various numbers of blocks currently in use, the number of I/Os made in the current session, and buffer pool data (hit rates and flush limit).
All values shown in the display refer to the current database session.
![]() To display database activity information
To display database activity information
Expand the database for which information is to be displayed.
Expand the Information object and select the Database Activity object. The Database Activity Information page is displayed.
The properties displayed have the following meaning:
Buffer Pool Size
The size of the internal memory cache that is used for reading and
writing database blocks.
Current Used Buffer Pool Size
The amount of the buffer pool currently in use.
Current Number of Index Blocks
The number of the database's Index container blocks currently in the
buffer pool.
Current Number of Data Blocks
The number of the database's Data container blocks currently in the
buffer pool.
Current Number of Temp Blocks
The number of the database's Temp container blocks currently in the
buffer pool.
Number of Buffer Flushes
The number of times that a buffer flush has occurred. During a buffer
flush, all of the modified database blocks are written from the buffer pool
back into the database's physical store. If the number of modified blocks is
large, the buffer flush operation can result in a significant I/O load while it
is running.
Logical Reads
The total number of database blocks that have been read from the
buffer pool.
If a read request is issued for a block that is not in the buffer pool, a physical read is performed automatically to retrieve the block from the physical store. Once the block is in the buffer pool, the logical read operation can be completed, and the number of logical reads will be incremented by 1.
Physical Reads
The total number of database blocks that have been read from the
physical database store. A block is only read from the physical store when it
is not already in the buffer pool.
Physical Writes
The total number of database blocks that have been written to the
database's physical store during the session's buffer flushes.
Buffer Pool Hit Rate
The success rate of retrieving database blocks from the buffer pool
without having to perform a read from the physical store. The figure displayed
is given by 100 * (logical reads - physical reads) / (logical reads).
Current Buffer Pool Hit Rate
As for Buffer Pool Hit Rate, but limited to the time period between
the previous and current activations of the Database Activity display in the
Tamino Manager.
The first time the display is activated in the current session, the value for Current Buffer Pool Hit Rate is the same as for Buffer Pool Hit Rate.
Flush Limit
The maximum allowed size of the modified database blocks in the
buffer pool. When this size is reached, a buffer flush is started
automatically.
Modified Pages in Buffer Pool
This shows the percentage of blocks in the buffer pool that have been
modified.
Dynamic Pool Size
The size of the dynamic pool. The dynamic pool is a separate cache
area, not part of the main buffer pool, and is used as a work area for certain
operations such as sort and search operations. The dynamic pool is shared
across all users of the system.
Current Used Dynamic Pool Size
The amount of the dynamic pool currently in use.
Maximum Pool Usage
The high-water mark of dynamic pool usage during the current
session.
Current Number of Space Waiters
The number of users/applications that are currently waiting for space
allocation in the dynamic pool.
Total Number of Space Waiters
The total number of users/applications that have waited for space
allocation in the dynamic pool during the current session.
See the section Display/Modify Database Properties for information about how to change property settings
This display includes the following information about the database spaces:
- Space Count
The number of spaces that physically exist
- Total Size
The sum of all allocated space of all physical spaces of a given space category
- Free Space Size
The amount of unused space for the Index, Data and Journal spaces
- Free Location Size
The sum of all free space of all locations assigned to a given space category
![]() To display space usage information
To display space usage information
Expand the database for which information is to be displayed.
Expand the Information object and select the Space Usage object. The Space Usage Information page is displayed.
The Current Request function shows the requests that are currently running against Tamino, and it allows you to stop one or all requests. The display includes the known current requests with the name of the collection, the start time, and information about the command. Select the request to be stopped, or choose the button to select all requests. To cancel the selected request(s), choose the button.