Tamino is a fast, flexible, and highly scalable DBMS. However, when writing large-scale, high-performance Tamino applications, the first step to finding potential bottlenecks is to discover where the application spends most of its time.
Tamino API for .NET can help you to accomplish this task: it provides some basic mechanisms for gathering detailed information about execution times. This enables the application developer and the database designer to get more detailed information than would be available without this functionality. Tamino API for .NET does not include statistical tools to summarize or process the measurement results. Since standard Windows concepts are used to provide the measured values, any tools available on the Windows platform can be used instead.
The next section gives an overview of the operations that can be measured and the different values that can be measured. The following section describes the architecture and technical concepts used for measuring and monitoring. The final section in this document guides you through samples that demonstrate how to use the “Measuring Operation Duration” feature.
Measuring support is provided for most operations that submit requests to Tamino. The measurements are categorized into:
Operations of the API core classes;
Operations of the TaminoDataAdapter class.
TaminoDataAdapter Operations
Support for the TaminoDataAdapter class is
layered on top of support for the core API classes such as
TaminoCommand. A
TaminoDataAdapter operation usually performs one or more
TaminoCommand operations, and then some additional
DataSet-related processing. Tamino API for .NET
allows you to enable the measurement of core API operations and
DataSet related operations separately. For the execution
of TaminoDataAdapter operations, this means that
if measuring the core API operations is enabled and measuring
the DataSet-related operations is disabled, then the core API
operations performed by the TaminoDataAdapter are
measured nevertheless.
The following times can be measured for all core API data operations:
The time taken from the start of the operation until the end of the operation. This is the total processing time within the API, including XmlParseDuration and TotalCommunicationDuration.
The time taken for the parsing of the XML response document.
The time taken from submitting the request to Tamino until the response document is completely received. Note that this includes TaminoServerDuration.
The time taken for the request to be processed by the Tamino Server.
TaminoDataAdapter Operations
The following times can be measured for
TaminoDataAdapter operations:
The time taken from the start of the operation until the end of the operation. This includes TotalCoreOperationDuration.
The total time taken for processing all core operations of the Tamino API for .NET within the adapter operation.
The following time is additionally provided for Fill operations:
To update data from a DataSet, the data and
the DataSet have to meet some requirements. See also
Populating a Dataset for Update >
Loaded Data and Tables. The TaminoDataAdapter
performs some checks when a DataSet is filled for
updates. HierarchyValidationDuration is the time spent performing these checks
when a Fill operation is executed.
The following times are additionally provided for Update operations:
The first step when performing an Update operation is to collect the
modifications done in the DataSet. The inserted, deleted
and modified rows in the DataSet and their corresponding
XML subtrees must be located. CollectModificationDuration is the time spent
collecting the modified XML subtrees.
DataSets have limitations regarding the ordering when inserting
elements. The TaminoDataAdapter includes some
experimental code to correct the order in some common cases (see also
XmlSchema Validation for Inserted XML
Elements). InsertCorrectionDuration is the time spent trying to
correct the ordering during an Update operation.
All times are measured in milliseconds.
Depending on the performed operation, not all of the measured values will necessarily be non-zero. For example, when deleting a document, there is no need to parse a response document. XmlParseDuration is zero for operations, such as TaminoCommand.QueryStream(), in which the returned response document is not parsed by the Tamino API for .NET. Also note that the sum of individual durations may not be exactly equal to the total operation duration; this is because measurements are made in different processes and possibly on different computers.
When a .NET application is running, the .NET garbage collector will probably be started from time to time. This implies that even if you run exactly the same operation with exactly the same data twice, the measured times can differ. Garbage may be collected whilst the operation is in progress, and this can increase the measured times. Furthermore, the division between the different measured durations is not absolute. It is important to understand that the measurement feature of the Tamino API for .NET cannot answer the question: “Exactly how long does operation x with data y take?”; rather, it helps you to answers questions like: “Where does the application spend most of its time?” or: "Does the program run faster after making the change?"
The Tamino API for .NET takes advantage of the performance monitoring concepts that are supported in the Microsoft platform. In order to satisfy different use cases, two alternatives are supported:
Windows Performance Counters;
Windows Management Events.
Both concepts have in common that the application being measured and the component that is monitoring or logging the measured values are loosely coupled. This means that the application and the monitor or logger are independent executables accessing shared Performance Counter/Management Event objects.
Performance counters are preferable if you want to monitor durations over time using the Microsoft Performance Monitor. This is typically the case if you have a long-running application and are interested in its behavior over time (rather than in every executed operation or details about the executed operation).
If you want information about every single operation, or if you are interested in operation details such as the URL accessed by the operation, it would be better to use Tamino API for .NET’s ability to fire management events.
Whichever concept you plan to use, the performance counters and/or management events cannot be seen on your system until you have executed a simple installation step, which is described below. The following gives a brief overview of how to measure and monitor an application using the different concepts.
To install the necessary resources for the performance counters and management events provided by the Tamino API for .NET, run the Installer tool of the .NET Framework:
Open a command prompt in the directory TaminoAPI4DotNET\lib, where TaminoAPI4DotNet is the installation directory of the Tamino API for .NET.
Invoke the command installutil TaminoAPI.dll
To uninstall the Tamino API for .NET related resources, do the following:
Open a command prompt in the directory TaminoAPI4DotNET\lib, where TaminoAPI4DotNet is the installation directory of the Tamino API for .NET.
Invoke the command installutil /u TaminoAPI.dll
For more information about the Installer tool, see the Microsoft .NET Framework documentation.
Unfortunately, versions 1.0 and 1.1 of the Microsoft .NET Framework do
not uninstall the Windows Management Instrumentation (WMI) schema that was
added for the management events TaminoCommandEvent and
TaminoDataAdapterEvent during installation (see
Using Management Events). You
can remove the schema by following these steps:
Open a command prompt
Invoke the Windows Management Instrumentation Tester by entering the
command wbemtest.exe
Select
In the field Server\Namespace enter "root\TaminoAPI", then select
Select . In the pop-up window,
enter the target class name TaminoCommandEvent. Select
.
Select . In the pop-up window,
enter the target class name TaminoSchemaCommandEvent.
Select .
Select . In the pop-up window,
enter the target class name TaminoConnectionEvent.
Select .
Select . In the pop-up window,
enter the target class name TaminoCoreApiEvent. Select
.
Select . In the pop-up window,
enter the target class name TaminoDataAdapterEvent.
Select .
To activate measurement, add an appropriate key/value pair to the <appSettings> section in the .NET application configuration file of the application that is to be measured. The value must be either ""true"" or ""false"". If a key is not defined, its default value is ""false"".
The application configuration file must be located in the application directory. Its name must be the same as the name of the application, with the extension ".config".
The following keys control measurement of the Core API operations:
Switches on measuring for the TaminoCommand
operations. The measured values are provided as Windows performance
counters.
Switches on measuring for the TaminoCommand
operations. The measured values are provided as Windows management
events.
Switches on measuring for the
TaminoSchemaCommand operations. The measured values are
provided as Windows performance counters.
Switches on measuring for the
TaminoSchemaCommand operations. The measured values are
provided as Windows management events.
Switches on measuring for the
TaminoConnection/TaminoTransaction
operations. The measured values are provided as Windows performance
counters
Switches on measuring for the
TaminoConnection/TaminoTransaction
operations. The measured values are provided as Windows management
events.
The following keys control measurement of the
TaminoDataAdapter operations:
Switches on measuring for the
TaminoDataAdapter operations. The measured values are
provided as Windows performance counters.
Switches on measuring for the
TaminoDataAdapter operations. The measured values are
provided as Windows management events.
The following example switches on measuring for the
TaminoCommand operations and for the
TaminoDataAdapter operations. All measured values are
provided as Windows performance counters and also as Windows management
events.
<configuration>
	 <appSettings>
		  <add key=" TaminoCommandPerformanceCounters " value="true" />
		  <add key=" TaminoCommandManagementEvents " value="true" />
		  <add key=" TaminoDataAdapterPerformanceCounters " value="true" />
		  <add key=" TaminoDataAdapterManagementEvents " value="true" />
	 </appSettings>
</configuration>
The following example switches on measuring for the
TaminoCommand operations. The measured values are
provided as Windows performance counters.
<configuration>
	 <appSettings>
	 	 <add key=" TaminoCommandPerformanceCounters " value="true" />
	 </appSettings>
</configuration>
TaminoAPI4DotNET optimizes the reading of Tamino response documents. After executing a command, the response document is not read if the returned HTTP header contains all the required information; this saves a significant amount of overhead. For example, TaminoCommand.Query() always reads the response document, because information is required that is not contained in the HTTP header; by contrast, TaminoTransaction.Rollback() normally does not read the response document.
The variables XmlParseDuration and TaminoServerDuration are always set to zero if the response document is not read. You can set the following switch, which forces TaminoAPI4DotNET to read the response document always:
<configuration>
  <appSettings>
    <add key="TaminoReadResponseDocument" value="true" />
  </apSettings>
</configuration>
Setting this switch yields more measurement values. However, it disables the default optimization in TaminoAPI4DotNET, so operations may take slightly longer.
Windows performance counters allow applications, services and devices to publish performance data that can be monitored using the Microsoft Performance Monitor tool. Although performance counters are not new with .NET, their use has been simplified by the .NET Framework.
Windows itself comes with numerous predefined performance counters; other products such as .NET add their own performance counters that allow measurement of the .NET Framework and managed code that runs in the .NET Framework. For example, there are .NET specific performance counters that provide information about the .NET garbage collector.
Just as classes are grouped together in namespaces, so are performance counters grouped together in categories. The installation step described above sets up the following categories:
Tamino API for .NET
TaminoCommand;
Tamino API for .NET
TaminoSchemaCommand;
Tamino API for .NET
TaminoConnection;
Tamino API for .NET
TaminoDataAdapter.
TaminoCommand Category
The Tamino API for .NET
TaminoCommand category comprises the following
performance counters:
| Delete:TaminoServerDuration | Delete:TotalCommunicationDuration | Delete:TotalOperationDuration | Delete:XmlParseDuration |
| Insert:TaminoServerDuration | Insert:TotalCommunicationDuration | Insert:TotalOperationDuration | Insert:XmlParseDuration |
| NextPage:TaminoServerDuration | NextPage:TotalCommunicationDuration | NextPage:TotalOperationDuration | NextPage:XmlParseDuration |
| PreviousPage:TaminoServerDuration | PreviousPage:TotalCommunicationDuration | PreviousPage:TotalOperationDuration | PreviousPage:XmlParseDuration |
| Query:TaminoServerDuration | Query:TotalCommunicationDuration | Query:TotalOperationDuration | Query:XmlParseDuration |
| Retrieve:TaminoServerDuration | Retrieve:TotalCommunicationDuration | Retrieve:TotalOperationDuration | Retrieve:XmlParseDuration |
| Update:TaminoServerDuration | Update:TotalCommunicationDuration | Update:TotalOperationDuration | Update:XmlParseDuration |
The NextPage:* and PreviousPage:* performance counters measure the
durations when iterating through multi-page result sets
(TaminoPageIterator,
TaminoItemIterator). All other performance counters
apply to the corresponding methods in the TaminoCommand
class.
TaminoSchemaCommand Category
The Tamino API for .NET
TaminoSchemaCommand category comprises the following
performance counters:
| Define:TaminoServerDuration | Define:TotalCommunicationDuration | Define:TotalOperationDuration | Define:XmlParseDuration |
| Undefine:TaminoServerDuration | Undefine:TotalCommunicationDuration | Undefine:TotalOperationDuration | Undefine:XmlParseDuration |
The Tamino API for .NET TaminoConnectionCommand category comprises the following performance counters:
| Close:TaminoServerDuration | Close:TotalCommunicationDuration | Close:TotalOperationDuration | Close:XmlParseDuration |
| Commit:TaminoServerDuration | Commit:TotalCommunicationDuration | Commit:TotalOperationDuration | Commit:XmlParseDuration |
| Diagnose:TaminoServerDuration | Diagnose:TotalCommunicationDuration | Diagnose:TotalOperationDuration | Diagnose:XmlParseDuration |
| Open:TaminoServerDuration | Open:TotalCommunicationDuration | Open:TotalOperationDuration | Open:XmlParseDuration |
| Rollback:TaminoServerDuration | Rollback:TotalCommunicationDuration | Rollback:TotalOperationDuration | Rollback:XmlParseDuration |
TaminoDataAdapter Category
The Tamino API for .NET
TaminoDataAdapter category comprises the following
performance counters:
| Fill:HierarchyValidationDuration |
| Fill:TotalCoreOperationDuration |
| Fill:TotalOperationDuration |
| Update:CollectModificationDuration |
| Update:InsertCorrectionDuration |
| Update:TotalCoreOperationDuration |
| Update:TotalOperationDuration |
A performance counter can have several instances. An instance contains the counter values. Instances and performance counter values are transitory. Note that instances apply to a category as a whole, rather than to individual counters. This means that all counters within a category have each instance defined for the category.
A performance counter instance only exists as long as at least one
component is referencing the corresponding category. A referencing component
can be the application that is writing the performance counter values, the
Microsoft Performance Monitor, or some other application that is monitoring the
counters in this category. For example, as long as the Performance Monitor is
open and actively monitoring the Tamino API for .NET
TaminoCommand category, all performance counter
instances in this category are retained.
Each performance counter in each Tamino API for .NET category can have several instances. For an application that is being measured, the friendly name of the .NET application domain (System.AppDomain.CurrentDomain.FriendlyName) is used as the instance name. This allows assigning the measured values to different applications being measured simultaneously on the same system.
Example: Assume that measuring is switched on for the assemblies MyAssembly.exe and AnotherAssembly.exe, and assume that both executables are running simultaneously. For the Query:TaminoServerDuration performance counter the following two instances would exist: MyAssembly.exe and AnotherAssembly.exe.
You can use the Microsoft Performance Monitor tool to monitor and log performance counters. By means of the logging facilities you can, for instance, make the Performance Monitor write the measured values into a *.csv file; subsequently you can view this file via Excel or display it graphically using the graphical System Monitor part of the Performance Monitor tool.
Microsoft also provides a WMI extension for Visual Studio .NET for download.
Windows Management Instrumentation (WMI) is an object-oriented framework for accessing management-related information. WMI is extensible, allowing applications to publish and access application-specific objects. The System.Management namespace in .NET provides a set of classes for working conveniently with WMI-based management information. For more information about WMI in .NET, see the .NET Framework documentation.
The Tamino API for .NET has been instrumented to provide performance information in the form of WMI management events. Instances of Tamino API for .NET specific management event classes are published at runtime. In contrast to performance counters, management events can expose all different kinds of properties and methods in a true object-oriented way.
Within WMI, all management events that can be fired by the Tamino API for .NET are defined in the namespace "root\TaminoAPI".
TaminoCommandEventProvides information about executed operations of
TaminoCommand objects.
TaminoSchemaCommandEventProvides information about executed operations of
TaminoSchemaCommand objects.
TaminoConnectionEventProvides information about executed operations of
TaminoConnection/TaminoTransaction
objects.
TaminoCommandEvent,
TaminoSchemaCommandEvent and
TaminoConnectionEvent are subclasses of
TaminoCoreApiEvent.
The following information is provided by all subclasses of
TaminoCoreApiEvent:
The Application Domain of the application.
The ID of the thread on behalf of which the operation was performed.
The type of the executed operation.
The URL of the Tamino database on which the operation was executed.
The TaminoServerDuration value.
The TotalCommunicationDuration value.
The XmlParseDuration value.
The TotalOperationDuration value.
TaminoDataAdapter Class
TaminoDataAdapterEventProvides information about executed operations of
TaminoDataAdapter objects.
Information provided by
TaminoDataAdapterEvent:
The Application Domain of the application.
The ID of the thread on behalf of which the operation was performed.
The type of the executed operation: Fill, Update, FillSchema.
The TotalOperationDuration value.
The TotalCoreOperationDuration value.
The HierarchyValidationDuration value.
The InsertCorrectionDuration value.
The CollectModificationDuration value.
TaminoCoreApiEvent and
TaminoDataAdapterEvent Instances
Whenever an operation of the TaminoCommand
class is executed, a TaminoCommandEvent instance is
created and fired. This means that when running an application, there will be a
TaminoCommandEvent object for each executed operation.
The same is true for TaminoSchemaCommandEvent,
TaminoConnectionEvent and
TaminoDataAdapterEvent objects.
An event instance only exists as long as some component is referencing the instance. A component can be either the application that is firing events or another application that is watching fired events.
If you are using Visual Studio .NET, a convenient way to watch management events at development time is to download Management (WMI) Extensions for Visual Studio .NET RTM Server Explorer from the Microsoft download center. Another option is to use the .NET Managed Classes (included in the .NET framework) to write a simple event viewer that meets your requirements. The MeasuringSamples include a simple example event watcher.
The following shows how to measure operation durations for the CoreAPIPerformanceCounters sample and the CoreAPIManagementEvents that are included in the measuring samples.
Before you can run the samples, you must:
Install the resources as described in the Installation and Uninstallation section above;
Build the samples, for example by running
buildAll.cmd in the
TaminoAPI4DotNET/samples
directory;
Run the script LoadSampleData.cmd in the
TaminoAPI4DotNET/samples
directory.
Both examples perform the following core API operations on the property
Doctype in the APISimpleSamples2 collection:
Create a TaminoConnection object and open the
connection;
Insert XML documents;
Execute an XQuery;
Delete the inserted documents using an XQuery-Update statement;
Close the connection.
To run the samples, you can use the script
runCoreMeasuringSamples.cmd, which you can find in
the TaminoAPI4DotNET directory.
The script runs the following two samples one after the other:
CoreAPIPerformanceCounter;
CoreAPIManagementEvents.
Before running them, it automatically copies the application
configuration file to
TaminoAPI4DotNET/samples/MeasuringSamples/CoreAPIPerformanceCounter/bin/Release
and
TaminoAPI4DotNET/samples/MeasuringSamples/CoreAPIManagementEvents/bin/Release
respectively. If you do not use the
runCoreMeasuringSamples.cmd script to run the
samples, make sure that the configuration files are in the application
directory before starting the application.
In order to measure and monitor operation durations, you must perform the following steps:
Activate measuring for your application by setting the appropriate entries in the application configuration file;
Monitor the running application.
The following sections first explain these two steps, and then provide some step-by-step guidelines for monitoring durations for TaminoCommand.Insert operations using the Microsoft Performance Monitor.
The file TaminoAPI4DotNET/samples/MeasuringSamples/CoreAPIPerformanceCounter/CoreAPIPerformanceCounter.exe.config includes the following entry:
<configuration>
 	<appSettings>
	  	<add key="TaminoCommandPerformanceCounters" value="true" />
		  <add key="TaminoSchemaCommandPerformanceCounters" value="true" />
		  <add key="TaminoConnectionPerformanceCounters" value="true" />
	 </appSettings>
</configuration>
Monitoring can be done using the Microsoft Performance Monitor. One
way to start the Performance Monitor is to open a command prompt window and
enter the command perfmon.exe. Another way is via
the menu sequence >
> > >
.
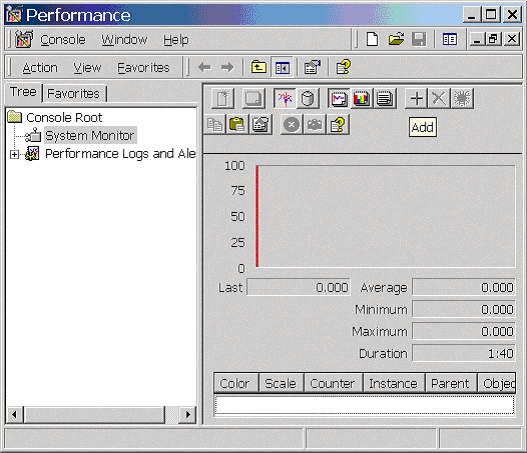
Right-click in the details pane (that is the right-hand pane) of the
Performance Monitor, then select You
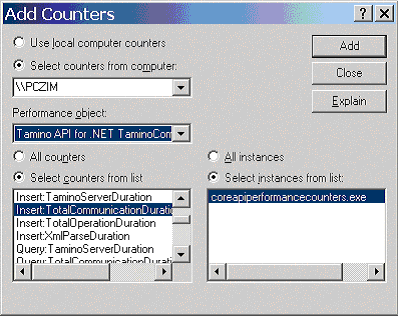
will see the available performance counters in the Tamino API for
.NET TaminoCommand category. No instances
are visible, because they are not created until the application is started.
Note also that the instances are only retained as long as some application is
referencing the corresponding category.
In order to understand the next steps, we must look at how performance counters are monitored and which applications we would usually monitor.
Let’s look at the TaminoCommand.Insert operations executed by CoreAPIPerformanceCounter.exe. When the first TaminoCommand.Insert is executed, a performance counter instance with the name “coreapiperformancecounter.exe” is created. Remember that performance counter instances apply to the category as a whole. This means that after the first TaminoCommand.Insert, the following counters exist:
| Counter Name | Instance Name |
|---|---|
| Delete:TaminoServerDuration | coreapiperformancecounter.exe |
| Delete:TotalCommunicationDuration | coreapiperformancecounter.exe |
| Delete:TotalOperationDuration | coreapiperformancecounter.exe |
| Delete:XmlParseDuration | coreapiperformancecounter.exe |
| Insert:TaminoServerDuration | coreapiperformancecounter.exe |
| Insert:TotalCommunicationDuration | coreapiperformancecounter.exe |
| Insert:TotalOperationDuration | coreapiperformancecounter.exe |
| Insert:XmlParseDuration | coreapiperformancecounter.exe |
| Query:TaminoServerDuration | coreapiperformancecounter.exe |
| Query:TotalCommunicationDuration | coreapiperformancecounter.exe |
| Query:TotalOperationDuration | coreapiperformancecounter.exe |
| Query:XmlParseDuration | coreapiperformancecounter.exe |
| Retrieve:TaminoServerDuration | coreapiperformancecounter.exe |
| Retrieve:TotalCommunicationDuration | coreapiperformancecounter.exe |
| Retrieve:TotalOperationDuration | coreapiperformancecounter.exe |
| Retrieve:XmlParseDuration | coreapiperformancecounter.exe |
| Update:TaminoServerDuration | coreapiperformancecounter.exe |
| Update:TotalCommunicationDuration | coreapiperformancecounter.exe |
| Update:TotalOperationDuration | coreapiperformancecounter.exe |
| Update:XmlParseDuration | coreapiperformancecounter.exe |
Whenever the application executes a TaminoCommand.Insert, the values of the following counters are modified:
| Counter Name | Instance Name |
|---|---|
| Insert:TaminoServerDuration | coreapiperformancecounter.exe |
| Insert:TotalCommunicationDuration | coreapiperformancecounter.exe |
| Insert:TotalOperationDuration | coreapiperformancecounter.exe |
| Insert:XmlParseDuration | coreapiperformancecounter.exe |
When monitoring a performance counter, the Microsoft Performance Monitor interrogates the current values of the monitored counters every X seconds. This implies that performance counters are well suited for monitoring application behavior over time; they are less well suited for measuring the duration of a single call.
When should we select the instances for monitoring in the Performance Monitor? Considering long-running applications and monitoring behavior over time, the answer is: First start the application, then select the instances for monitoring/logging.
Note:
Since CoreAPIPerformanceCounter.exe is not really a long running
application, it includes some Thread.Sleep calls in order to make it run
longer.
Hint: Instead of selecting the performance counter instances by hand, you can also use System Monitor Templates to easily start monitoring pre-defined performance counters. The CoreApiPerformanceCounter sample includes a suitable template: TaminoAPI4DotNET/samples/MeasuringSamples/CoreApiPerformanceCounter/CoreApiPerformanceCounter.htm. To use this template, do the following in the Microsoft Performance Monitor:
If necessary, expand Performance Logs and Alerts;
Right-click ;
Select ;
Select CoreApiPerformanceCounter.htm.
The following summarizes the preceding descriptions.
Open a command prompt. Change to the TaminoAPI4DotNET/samples directory.
Enter the command
runCoreMeasuringSamples.cmd
Start the program perfmon.exe
Right-click in the right-hand pane, then select
Add the four counters related to the TaminoCommand.Insert operation:
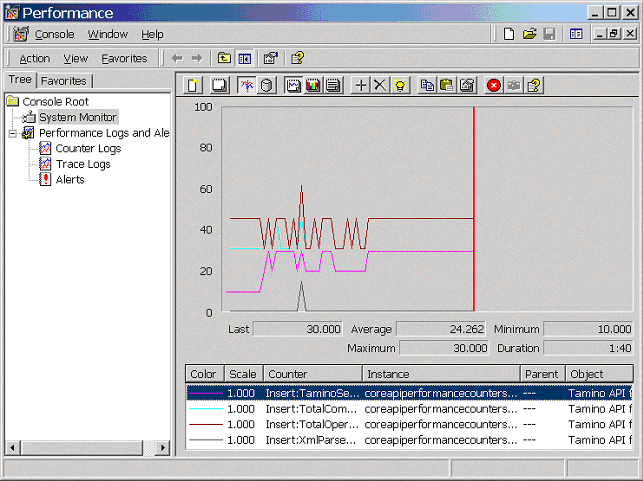
If the application has already finished, start
runCoreMeasuringSamples.cmd again. After a couple of
minutes, you will see a graph similar to the following:
To measure and monitor operation durations, perform the following steps:
Enable measuring for your application via the application configuration file.
Start an event watcher.
Run the application to be measured.
The file TaminoAPI4DotNET/samples/MeasuringSamples/CoreAPIPerformanceCounter/CoreAPIManagementEvents.exe.config includes the corresponding entry:
<configuration>
 	<appSettings>
  		<add key="TaminoCommandManagementEvents" value="true" />
  		<add key="TaminoSchemaCommandManagementEvents" value="true" />
  		<add key="TaminoConnectionManagementEvents" value="true" />
 	</appSettings>
</configuration>
The measuring samples include the source code for a simple event
watcher. The events that an application would like to watch for are specified
using the WMI Query Language (WQL). The following shows the basic code to
register an EventArrived method, which will be called
for each fired TaminoCoreApiEvent object:
WqlEventQuery query = new WqlEventQuery("TaminoCoreApiEvent");
query.QueryString = "SELECT * FROM TaminoCoreApiEvent";
ManagementScope scope = new ManagementScope(@"root\TaminoApi");
apiWatcher = new ManagementEventWatcher(scope,query);
apiWatcher.EventArrived += new
EventArrivedEventHandler(this.EventArrived);
The following code in the EventArrived
methods simply inserts all the application-specific properties of the fired
event into a DataSet:
DataSet ds = new DataSet();
DataRow row = coreDs.Tables[0].NewRow();

foreach ( PropertyData data in e.NewEvent.Properties)
{
  	row[data.Name] = data.Value.ToString();
}
ds.Tables[0].Rows.Add(row);
Remember that the Tamino API for .NET
includes three subclasses of the TaminoCoreApiEvent
class: TaminoCommandEvent,
TaminoSchemaCommandEvent and
TaminoConnectionEvent. In WQL you can also formulate
more specific queries; for instance, you might only want to listen for
TaminoCommandEvent objects with the OperationType
"Insert".
Open a command prompt. Change to the TaminoAPI4DotNET/samples directory.
Enter the command
runManagementEventWatcher.cmd
Select .
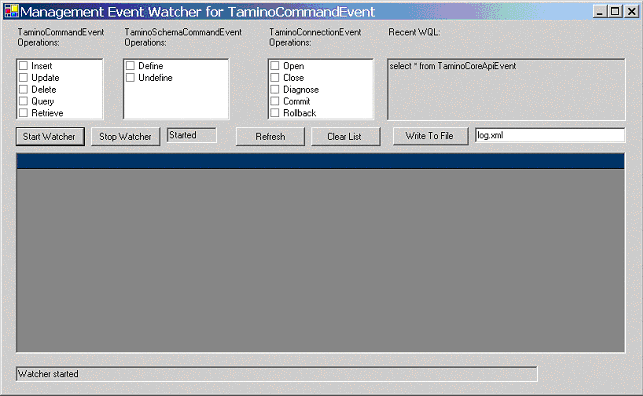
Start the application by entering the command
runCoreMeasuringSamples.cmd at the command
prompt.
In the EventWatcher, select . Select
the TaminoCoreApiEvent table.
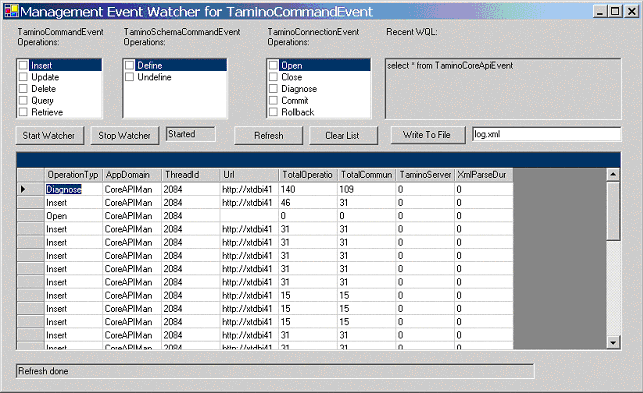
Select .
Select . This writes to the application directory a file similar to the following:
<?xml version="1.0" standalone="yes"?>
<NewDataSet>
…
 <TaminoCoreApiEvent>
    <OperationType>Insert</OperationType>
    <AppDomain>CoreAPIManagementEvents.exe</AppDomain>
    <ThreadId>2084</ThreadId>
    <Url>http://xtdbi4141-rc07/tamino/zimdb1/APISimpleSamples2</Url>
    <TotalOperationDuration>46</TotalOperationDuration>
    <TotalCommunicationDuration>31</TotalCommunicationDuration>
    <TaminoServerDuration>0</TaminoServerDuration>
    <XmlParseDuration>0</XmlParseDuration>
  </TaminoCoreApiEvent>
 …
 <TaminoCoreApiEvent>
    <OperationType>Query</OperationType>
    <AppDomain>CoreAPIManagementEvents.exe</AppDomain>
    <ThreadId>2084</ThreadId>
    <Url>http://xtdbi4141-rc07/tamino/zimdb1/APISimpleSamples2</Url>
    <TotalOperationDuration>62</TotalOperationDuration>
    <TotalCommunicationDuration>31</TotalCommunicationDuration>
    <TaminoServerDuration>50</TaminoServerDuration>
    <XmlParseDuration>31</XmlParseDuration>
  </TaminoCoreApiEvent>
…
</NewDataSet>