
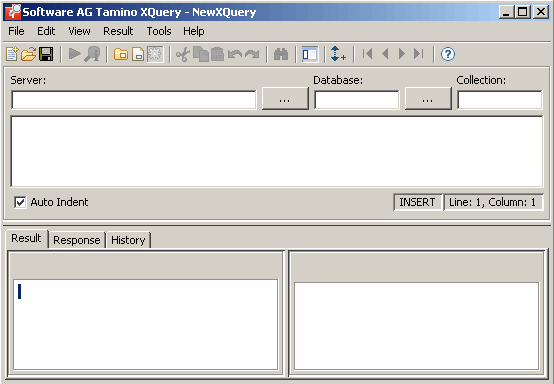
When you start the Tamino XQuery tool, its application window appears.
The following sample XQuery window contains all information that is required to execute a query: server, database, collection and the query expression.
The XQuery window contains several panes. To modify the size of a pane, move the mouse pointer over the border separating the panes until the pointer changes, showing two arrows pointing in opposite directions. Then drag the border using the mouse until the panes have the desired size.
For details on keyboard access not mentioned in this documentation, consult the documentation of the individual operating system or software product.
The following topics are covered below.
The following menus are available:
| Menu | Using the commands in this menu, you can ... |
|---|---|
| File | Create, open, execute, explain and save your queries. |
| Edit | Edit the current query (for example, cut, copy and paste text). |
| View | Switch on and off different elements of the XQuery window. |
| Result | Manage your results. |
| Tools | Define the options. |
| Help |
Invoke online help. |
For reference information on each menu command, see Menu Commands in a Tamino XQuery Tool Window.
You can execute the most important functions using the toolbar.
The following toolbar buttons are available:
 To switch the toolbar display on and off
From the menu, choose .
When the toolbar is displayed in the XQuery window, a check mark is shown next to this menu command.
The query area consists of the text boxes in which you enter the required server, database and collection, and a query editor in which you enter your query expression.
When you invoke an XQuery window from the Tamino X-Plorer, the currently selected object in the X-Plorer's navigation tree is automatically shown as a query expression. Server, database and collection containing the selected object are automatically provided in the text boxes. This if helpful if you do not want to type this information yourself. For example:
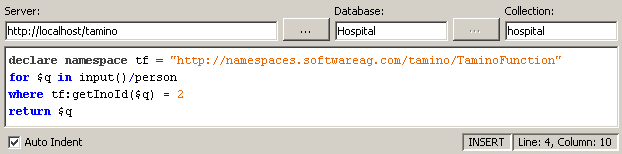
You can modify the query expression and/or execute the query. See Working with the Tamino XQuery Tool. When you invoke an XQuery window in standalone mode, you have to specify all of this information yourself (see Specifying an XQuery).
A query expression is specified using XQuery. See XQuery 4 User Guide and XQuery 4 Reference Guide in the Tamino XML Server documentation for detailed information.
Syntax highlighting is used. Several predefined styles with different
colors and font styles are provided. For example, a keyword style is provided
which shows the keywords of the XQuery language (such as for,
in, where or return) with the color blue
and with the font style bold.
Notes:
com.softwareag.xtools.xquery.editor.XQueryEditor.syntaxHighlighting=falseThe current position of the insertion point in the query editor is shown at the bottom of the query area (line and column). The information to the left of the position indicates whether insert mode or overwrite mode is currently active. The mode can be toggled using the INS key.
The XQuery code is automatically indented in the query display area if you check the Auto Indent box. This can help to make the code easier for you to read if the code contains nested structures.
The Result pane is shown at the bottom of the XQuery window.
The following topics are covered below:
More information is provided in the section Managing XQuery Results.
After you have executed a query (see Executing an XQuery), the left side of the Result pane shows a tree with the query result. The number of result packs shown depends on the defined result fetch options (see Specifying the Result Fetch Options).
Note:
The navigation tree is not shown when an error message is displayed
or when an explanation of a query is displayed.
Depending on your query expression, different types of query result are provided. Each result shows either instances or fragments:
Instances
Complete instances are shown when you search for a doctype, for
example, when your query expression is
"input()/patient".
Fragments
A fragment is a small part of an instance. It is shown when you
specify, for example, "input()/name/firstname" which
shows all first names not considering their locations in the XML object (i.e.
this can be the first name of a patient or doctor).
The instances or fragments receive consecutive numbers preceded by a hash (#) character.
The following icons may appear in the navigation tree. They are shown as the result of an XQuery.
|
|
XML instance as it was stored in Tamino. |
|
|
Fragment of an XML instance, or XML instance if an element constructor is used in the result. |
Arrows for browsing the instances may appear in the tree:
|
|
Click the plus sign next to this symbol to fetch and display the next pack. When using the keyboard, select this symbol and press ENTER. |
|
|
Click the plus sign next to this symbol to fetch and display the previous pack. When using the keyboard, select this symbol and press ENTER. |
To switch the navigation tree display on and off
From the menu, choose .
Or:
Choose the following toolbar button:
![]()
When the navigation tree is displayed in the Result pane, a check mark is shown next to the command .
The right side of the Result pane shows one of the following:
When you have chosen the command, the contents of the result that is currently selected in the navigation tree is shown on the right side of the Result pane. See Executing an XQuery.
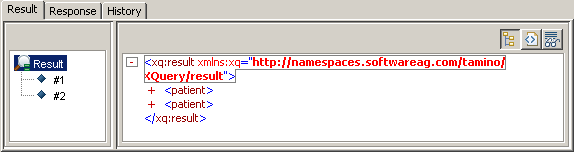
The following example shows the contents of a query in tree view:
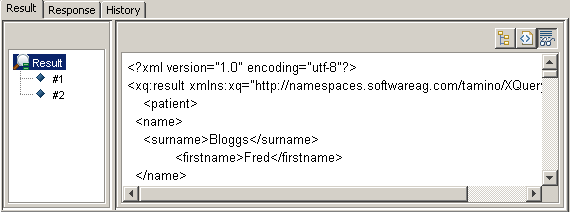
The following example shows the same result in plain view:
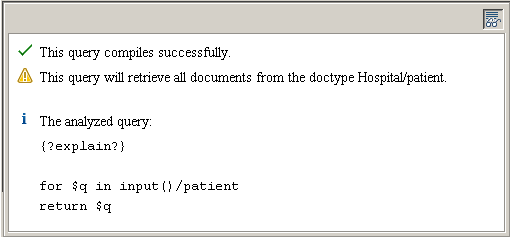
When you have chosen the command, an explanation of the query is shown. The navigation tree is not shown in this case. See Explaining an XQuery.
The following example shows the explanation of a query:
When an error has occurred, an error message is shown. The navigation tree is not shown in this case.
Depending on the type of object and the type of query, one or more views are available. When different views are available, they can be activated using the following buttons in the top right corner of the Result pane:
| Button | Keyboard | Description |
|---|---|---|
|
|
CTRL+SHIFT+T | Tree view providing the content of a result, an explanation of a query, or an error message. Whether lines are wrapped in tree view depends on the corresponding setting in the Options dialog box. See Setting the Tamino XQuery Tool Options for further information. |
|
|
CTRL+SHIFT+P | Plain view providing the content of a result, an explanation of a query, or an error message. |
Note:
In plain view, you can copy information using the corresponding command from the menu.
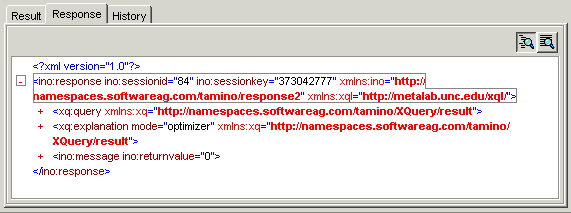
When you have chosen the
command (see Explaining an
XQuery), the Tamino response (ino:response)
is shown in the Response pane at the bottom of
the XQuery window.
In general, the success or failure of the client request is indicated in
the ino:returnvalue attribute of the ino:message
element of the response document. A value of 0 indicates a successful response,
whereas a non-zero value indicates either an error or a non-standard response.
For further information on the syntax of XML responses and on the elements and
attributes in Tamino response documents, see X-Machine Programming, section
Requests using X-Machine
Commands in the Tamino XML Server
documentation.
Different views are available. They can be activated using the following buttons in the top right corner of the Response pane:
| Button | Keyboard | Description |
|---|---|---|
|
|
CTRL+SHIFT+T | Tree view providing the response. Whether lines are wrapped in tree view depends on the corresponding setting in the Options dialog box. See Setting the Tamino XQuery Tool Options for further information. |
|
|
CTRL+SHIFT+P | Plain view providing the response. |
Note:
In plain view, you can copy information using the corresponding command from the menu.
Queries for which you have previously invoked the command (see Executing an XQuery) or the command (see Explaining an XQuery), are shown on the History pane at the bottom of the XQuery window.
The following topics are covered below:
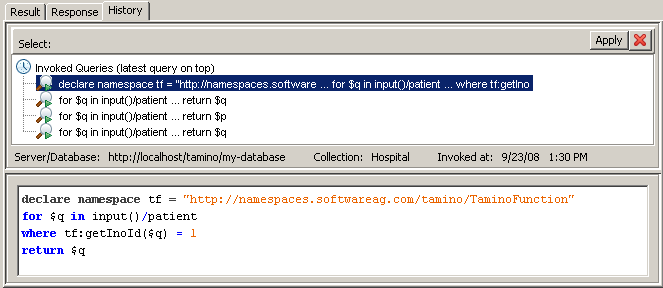
The top of the History pane shows a list with queries that have been previously invoked. The latest query is shown at the top of the list.
The maximum number of query entries and the maximum number of characters shown for each query entry depend on the corresponding settings in the Options dialog box. See Setting the Tamino XQuery Tool Options for further information.
When you select a query in the list, the following information about this query is shown below the list: server, database, collection and the date and time when this query was invoked.
The following buttons are provided:
| Copies the selected query to the query area so that you can modify and invoke it once more. A dialog box appears asking whether you want to save the query which is currently displayed in the query area. Alternative: double-click the desired query. | |
|
|
Deletes the selected query from the history. The query is deleted immediately. You are not asked to confirm the deletion. |
The bottom of the History pane shows the entire query (read-only) for the item that is currently selected in the query list.
For information on syntax highlighting, see Query Area.