 To create a report that retrieves data from Tamino
Perform this procedure in the customized Software AG Eclipse environment.
Create a Reporting Project.
From the Eclipse workbench, choose the menu entry > > .
The "New Project" wizard is started. In the list of wizards (shown below), select Business Intelligence and Reporting Tools > Report Project.
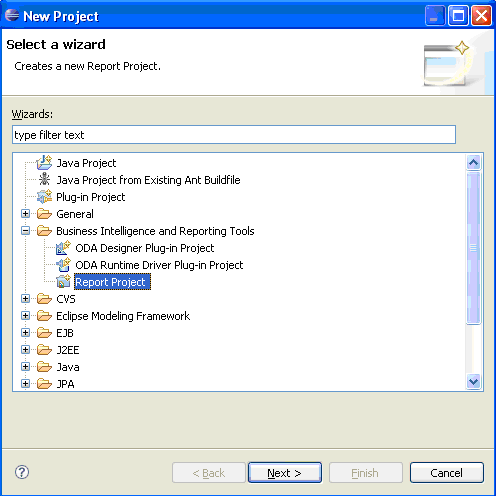
Choose .
In the next window, specify the name of the project.
Create a Report.
In the Eclipse navigator, select your newly-created project. From the context menu (right mouse button), choose New > Report. In the following window, specify the name of the report.
Create a Data Source.
In the Eclipse reporting perspective, go to the Data Explorer view, select Data Sources, then from the context menu (right menu button) select New Data Source.
In the New Data Source wizard, ensure that the radio button Create from a data source type in the following list is checked, then select Tamino Database.
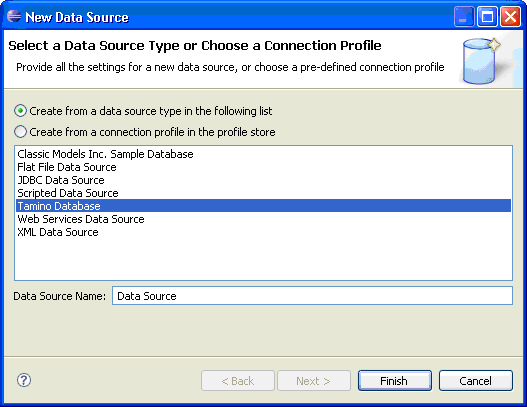
Choose .
Create a Data Set.
Select the data set. From the context menu, choose New Data Set.
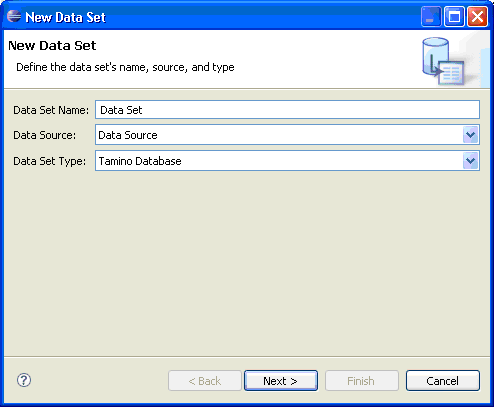
In the next window, you can specify the data set's name, source and type:
In the next window, you can enter a query. The query should not use a serialization specification in the query prologue, nor should it include updating expressions:
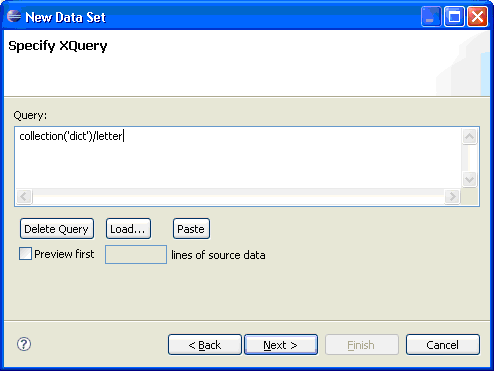
If the query returns a long list of results, you can use the Preview first nn lines of source data facility to limit the output.
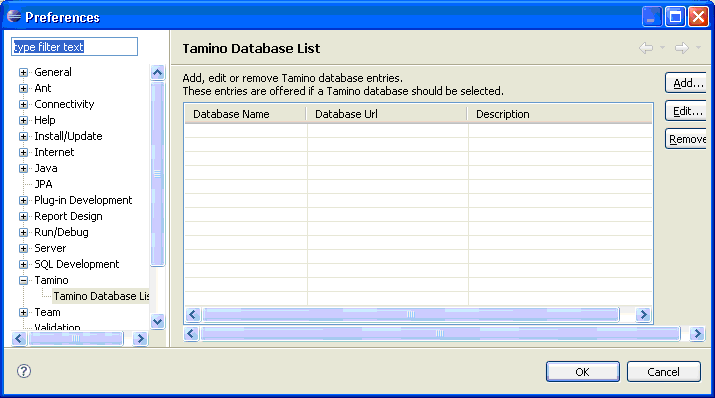
If a database URL has not yet been specified, the first time you run a query the Eclipse preference dialog will prompt you to specify the target database:
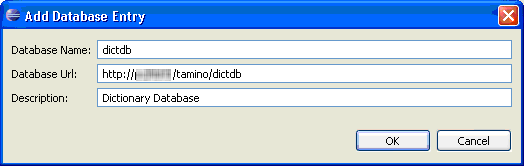
Choose to add a new database URL, in the form http://<server-url>/tamino/<database>:
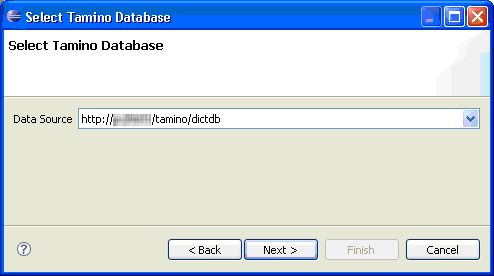
A pop-up now prompts you to choose select the database that is to be queried:
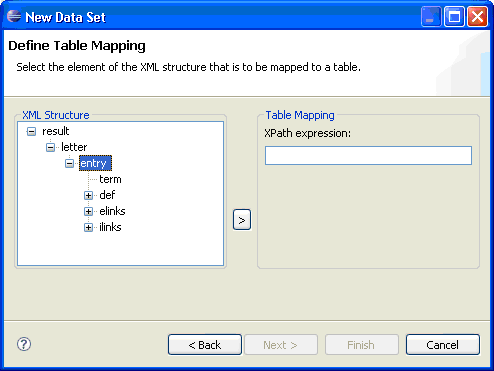
Put a table into the report and include the data from the data set.
In the next window, specify the element that should become the anchor of the intermediate result table:
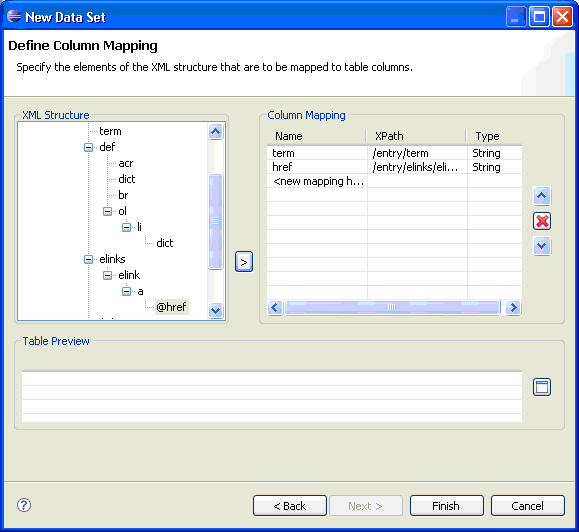
In the next step, specify the columns that should be included in the table:
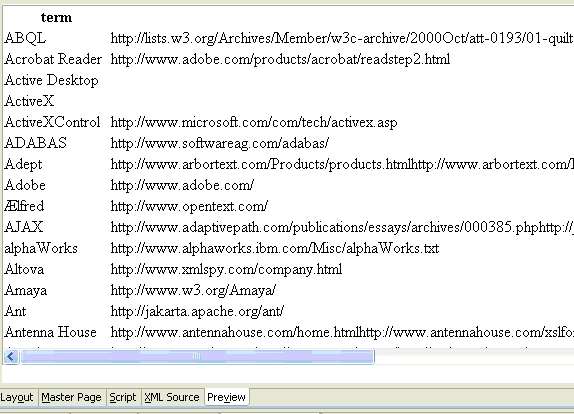
You can now check your work by choosing . This should show the result of your query:
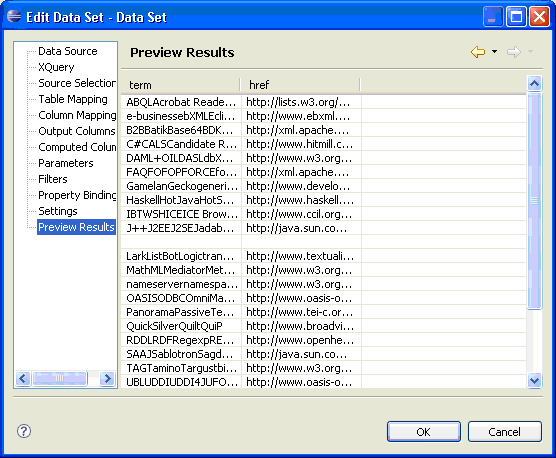
In general, the options provided here correspond to the Tamino Reporting project, but the option Source Selection allows you to query from another database.
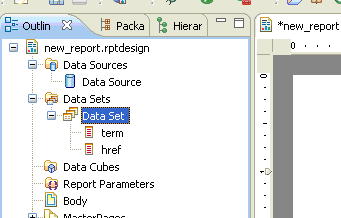
Choose . You should now see the fields that you selected for the internal table, i.e. the output columns, beneath the data set's entry in the Eclipse Data Explorer view:
You can now use the data in a report. The easiest way to do this is to open the Eclipse Palette view, drag a table (2 columns) into the report editing area, then drag the two data fields into the detail row cells. Save the report, then preview it. It should show the data in the report: