To display the page from | Do this |
KPI Summary page | Click |
Rule Detail page | Click |
Component | Description |
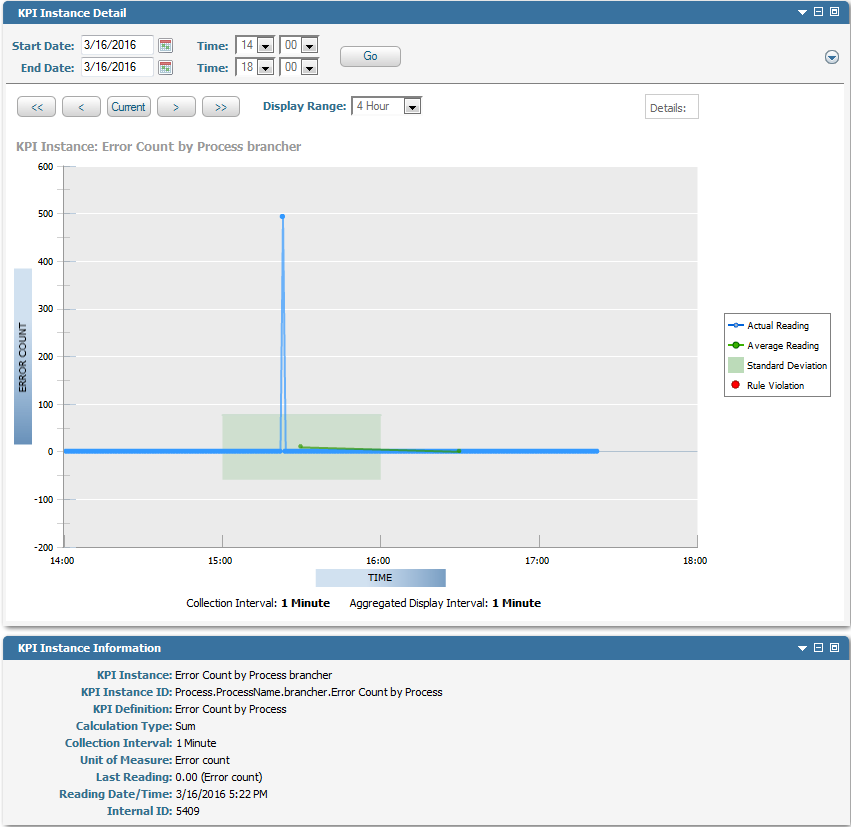
Actual Reading | The data points on the performance line for the KPI instance. For information about how KPIs calculate data points, see
Key Performance Indicators. |
Average Reading | The historical average values for this KPI instance across all historical readings in the statistical interval. These values are based on the mode of operation for KPI historical values. For more information, see
KPI Historical Average Values. |
Standard Deviation | The standard deviation across all historical readings in the statistical interval. These readings are based on the mode of operation for KPI historical values. For more information, see
KPI Historical Average Values. |
Rule Violation | Red dots (if any) indicate that rule violations occurred at the data point. |
Collection Interval | The KPI instance's data collection interval: 1 minute, 5 minutes, 10 minutes, 15 minutes, 30 minutes, 1 hour, 2 hours, 4 hours, or 8 hours. |
Aggregated Display Interval | The interval between the data points for the actual reading displayed in the graph area. For more information, see
Data Aggregation on KPI Instance Detail
Page. |
KPI Instance Notes | When icons appear, they indicate statistical abnormalities, rule violations, etc. For more information about these icons, see
Optimize Icons. |
KPI Instance | The name of the KPI instance. |
KPI Instance ID | Identifier for the KPI instance. |
Calculation Type | The KPI's calculation type: sum, average, last value, min, max, state, or count. For a description of these calculation types, see
Key Performance Indicators. |
Collection Interval | The KPI's data collection interval. The minimum collection interval is one minute. The maximum is eight hours. |
Unit of Measure | The KPI's unit of measure (for example, steps or seconds). |
Last Reading | The value of the most recent aggregated data point collected for the KPI instance within the selected time period. Optimize displays aggregated data collection points only for completed display intervals. For example, the aggregated display interval is five minutes. Optimize does not display the aggregated data point for the five-minute display interval until the interval ends. |
Reading Date/Time | Date and time when the most recent data point was calculated, within the selected time period. |
Internal ID | Unique identifier of the KPI instance used in the database. |
Row | Description |
Mean | For the selected time period, historical average values for the KPI instance across all historical readings in the statistical interval. These values are based on the mode of operation for KPI historical values. Value is for the most recent mean data point within the selected time period. For more information, see
KPI Historical Average Values. |
Standard Deviation | For the selected time period, historical standard deviation across all historical readings in the statistical interval. These are values for the most recent standard deviation data point within the selected time period These values are based on the mode of operation for KPI historical values. For more information, see
KPI Historical Average Values. (Not available if confidence is below threshold.) |
Statistical Confidence | One minus the statistical significance. The larger this value is, the more likely that the difference between the last reading and the mean is due to chance. |
Row | Description |
Number of Readings | Total number of data points calculated in the selected time range. |
Mean | Mean value of data points calculated in the selected time range. |
Minimum | Data point with the lowest value in the selected time range. |
Maximum | Data point with the highest value in the selected time range. |
If you want to | Do this |
View a value for a point on the graph. | Rest the mouse pointer on the point. Note: Values are rounded off to two decimal places. For greater accuracy, view the data points in tabular format. |
Create a rule | Click |
Generate a MashZone query for the currently displayed KPI instance information. | Click Note: The information contained in the query string can be copied and then pasted into the MashZone application, where the data presentation can be further processed. For more information about working with Software AG MashZone, see the MashZone online help. |
Display the value of the data plotted on the graph, in tabular format. | Click |
View information about the diagnosis performed on the item. | Rest the mouse pointer on the diagnosis trend (such as  ) to see a brief description of the diagnosis that Optimize performed on the item. For a more detailed description, see
Optimize Icons. ) to see a brief description of the diagnosis that Optimize performed on the item. For a more detailed description, see
Optimize Icons. |
View details about a rule. | Click |
View details about a rule violation. | Click Tip: For rule violations, you can also view rule details by clicking a red circle on the graph. |